Why this topic?
I chose this topic because I’ve seen a lot of different queries to hunt for signs of credential dumping. However, these have been mostly developed around finding certain tools which do dump the credentials. My idea was to try to hunt for the activity done by the application which dumps the memory of a process (lsass.exe in this example). Then the hunting query could be used to hunt the actual activity and not rely on the actual application which dumps the memory.
To get started I needed to generate data. I needed to see what the actual dumps looks a like by different applications.
![]()
Generating data by dumping lsass.exe memory
Let’s start with the easiest option. Task manager:
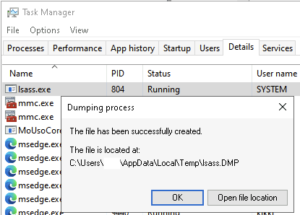 Task manager used to dump lsass memory
The next dump I created with comsvc.dll by initiating this command: rundll32.exe C:\windows\System32\comsvcs.dll, MiniDump 804 lsass.dmp full - where the number after MiniDump is the Process ID for the lsass.exe process.
One more before moving on to the hunting, which is systeinernals Procdump tool: procdump.exe -accepteula -ma lsass.exe lsass.dmp.
All the tools worked fine in dumping the lsass.exe when ran from an admin prompt. Good to note though that the MDE console was really red after:
 MDE console colored red with danger
Creating the query
Now that we have some data available we can start creating a query to hunt for the activity. First, I want to have an overview of which kind of activity the processes are doing. I created a very simple query to list Actions and FileNames by the processes of interest:
search in (DeviceProcessEvents,DeviceNetworkEvents,DeviceFileEvents,DeviceRegistryEvents,DeviceLogonEvents,DeviceImageLoadEvents,DeviceEvents)
Timestamp >ago(3h)
and DeviceId == "ce8a64b7d864137ed1bf633d8fac1e2e1bcae92c"
and InitiatingProcessFileName has_any("taskmgr.exe","procdump64.exe","rundll32.exe")
| sort by Timestamp desc
| summarize Actions = make_set(ActionType), FileNames = make_set(FileName) by InitiatingProcessFileName, InitiatingProcessId, InitiatingProcessCommandLine, InitiatingProcessCreationTime
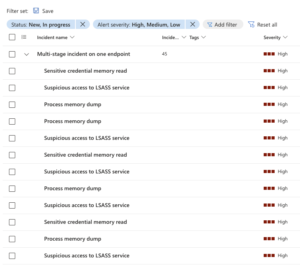
This produces a simple overview of actions taken by the processes in question:
 Overview of processes which dumped the lsass memory
What I can take from this then? Well All of them are creating files. The name of the created file is always lsass.dmp but it can be whatever else, so that is not a good indicator. Creating a file is. All of the processes are also creating the OpenProcessApiCall most likely targeting the lsass.exe process. Otherwise, there are no actions which wound unify all of the three actions. Not entirely true, there is the OtherAlertRelatedActivity. Obviously, this is not a good indicator though.
Starting with the API call:
let lookuptime = 30d;
DeviceEvents
| where Timestamp >ago(lookuptime)
| where ActionType == "OpenProcessApiCall"
| where FileName =~ "lsass.exe"
| project ApiCallTimestamp = Timestamp, InitiatingProcessFileName=tolower(InitiatingProcessFileName), InitiatingProcessCommandLine=tolower(InitiatingProcessCommandLine), InitiatingProcessId, InitiatingProcessCreationTime=tolower(InitiatingProcessCreationTime), InitiatingProcessParentFileName=tolower(InitiatingProcessParentFileName)
Joining the data to file creation events. I needed to use the tolower() function which sets all the strings to lowercase - the join is case sensitive and it seems that for taskmgr.exe there were differences in capitalization on the tables. After using tolower() it worked fine and the results were shown for all the processes. It is also good to note that I filtered the event order - results will be only shown if the file is created within 1 minute after the API call.
let lookuptime = 30d;
DeviceEvents
| where Timestamp >ago(lookuptime)
| where ActionType == "OpenProcessApiCall"
| where FileName =~ "lsass.exe"
| project ApiCallTimestamp = Timestamp, InitiatingProcessFileName=tolower(InitiatingProcessFileName), InitiatingProcessCommandLine=tolower(InitiatingProcessCommandLine), InitiatingProcessId, InitiatingProcessCreationTime=tolower(InitiatingProcessCreationTime), InitiatingProcessParentFileName=tolower(InitiatingProcessParentFileName)
| join (
DeviceFileEvents
| where ActionType == "FileCreated"
| where Timestamp >ago(lookuptime)
| project FileEventTimestamp = Timestamp, InitiatingProcessFileName=tolower(InitiatingProcessFileName), InitiatingProcessCommandLine=tolower(InitiatingProcessCommandLine), InitiatingProcessId, InitiatingProcessCreationTime=tolower(InitiatingProcessCreationTime), InitiatingProcessParentFileName=tolower(InitiatingProcessParentFileName), FileActionType = ActionType, FilePath = FolderPath, ModifiedFileName = FileName
) on InitiatingProcessFileName, InitiatingProcessCommandLine, InitiatingProcessId, InitiatingProcessCreationTime
| where FileEventTimestamp between (ApiCallTimestamp .. (ApiCallTimestamp + 1m))
| project ApiCallTimestamp, FileEventTimestamp, FilePath,FileActionType, ModifiedFileName, InitiatingProcessFileName, InitiatingProcessCommandLine, InitiatingProcessId, InitiatingProcessParentFileName
How about false-positives? Well first things first, this is straight out of my dev environment with 1 endpoint. There was NO actual False-Positives, though there were several file creation hits for procdump process:
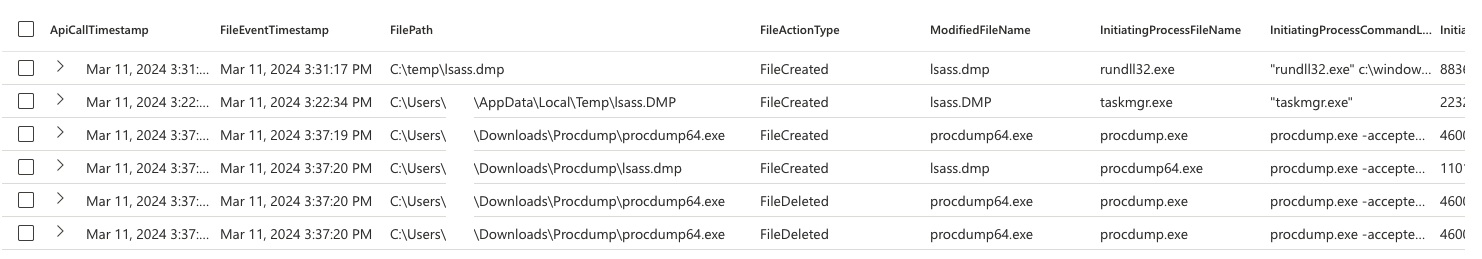 Results of the final query
Woop woop. The query is producing meaningful results. The image is BTW from a query where I didn’t yet filter the ActionType to FileCreation which is why there are additional rows - was just too lazy to screenshot the latest version. That’s it folks, happy hunting!