I’ve been somewhat busy lately and hadn’t had much time to write anything to the blog unfortunately. I also have had some issues in thinking of good topics as I don’t want to get stuck in running similar topics each time. I’ve been dealing with running different samples for couple of posts in a row so I though of something that would maybe make my life easier in the future; how about creating statistics of the malware that is currently being active?
![]()
My idea was to use all the data available over the sandbox services. I really don’t want to pay for the access so I first looked at tria.ge. This requires you to get access to the API as a researcher, which I requested but haven’t received at least yet. So I parked that for now. I started to look for other solutions (I’d like to have multiple anyway) and stumbled across abuse.ch. I also noted that they have done this work for me already in Malware Bazaar. :) So they have statistics already available here. There were somethings that could be improved, like setting the actual times from which you want to look the data from. Because of that, I still decided to go forward with the idea.
Malware bazaar
Abuse.ch has a free to use API which can be used to pull data from the past hour, amongst other things. So, I created a quick python script to do achieve this, pushing the data to local ELK:
from datetime import datetime
import urllib.request
import urllib.parse
import json
from elasticsearch import Elasticsearch
es = Elasticsearch("http://ES_host:9200")
data = urllib.parse.urlencode({'query': 'get_recent', 'selector': 'time'}).encode()
req = urllib.request.Request('https://mb-api.abuse.ch/api/v1/', data)
response = urllib.request.urlopen(req)
jsonResponse = json.loads(response.read())
for r in jsonResponse["data"]:
    r["timestamp"] = datetime.now()
    resp=es.index(index='mw_bazaar',document=r)
    print(resp['result'])
This is super simple. Works fine but I did add the timestamp so that gets indexed without much trouble. I wanted for the timestamp to be the ingestion time of the document so by adding the value to the dict does fine. Probably could be more fine-tuned though. I created a docker image of this with a crontab that I ran on my unraid host. I did follow this, however I reworked it quite a bit. Nothing fancy though, mostly installing the required python modules from a txt file and otherwise the logic is the same. I scheduled the script to run once a hour as it should pull the data from the last 60 minutes.
Now that I have some data flowing in I probably want to do some nice visualizations with Kibana to read the statistics - before moving on to the next data integration. The data that is flowing in from Malware Bazaar is quite simple so the visualization I created took all the 12 seconds to create with Kibana.
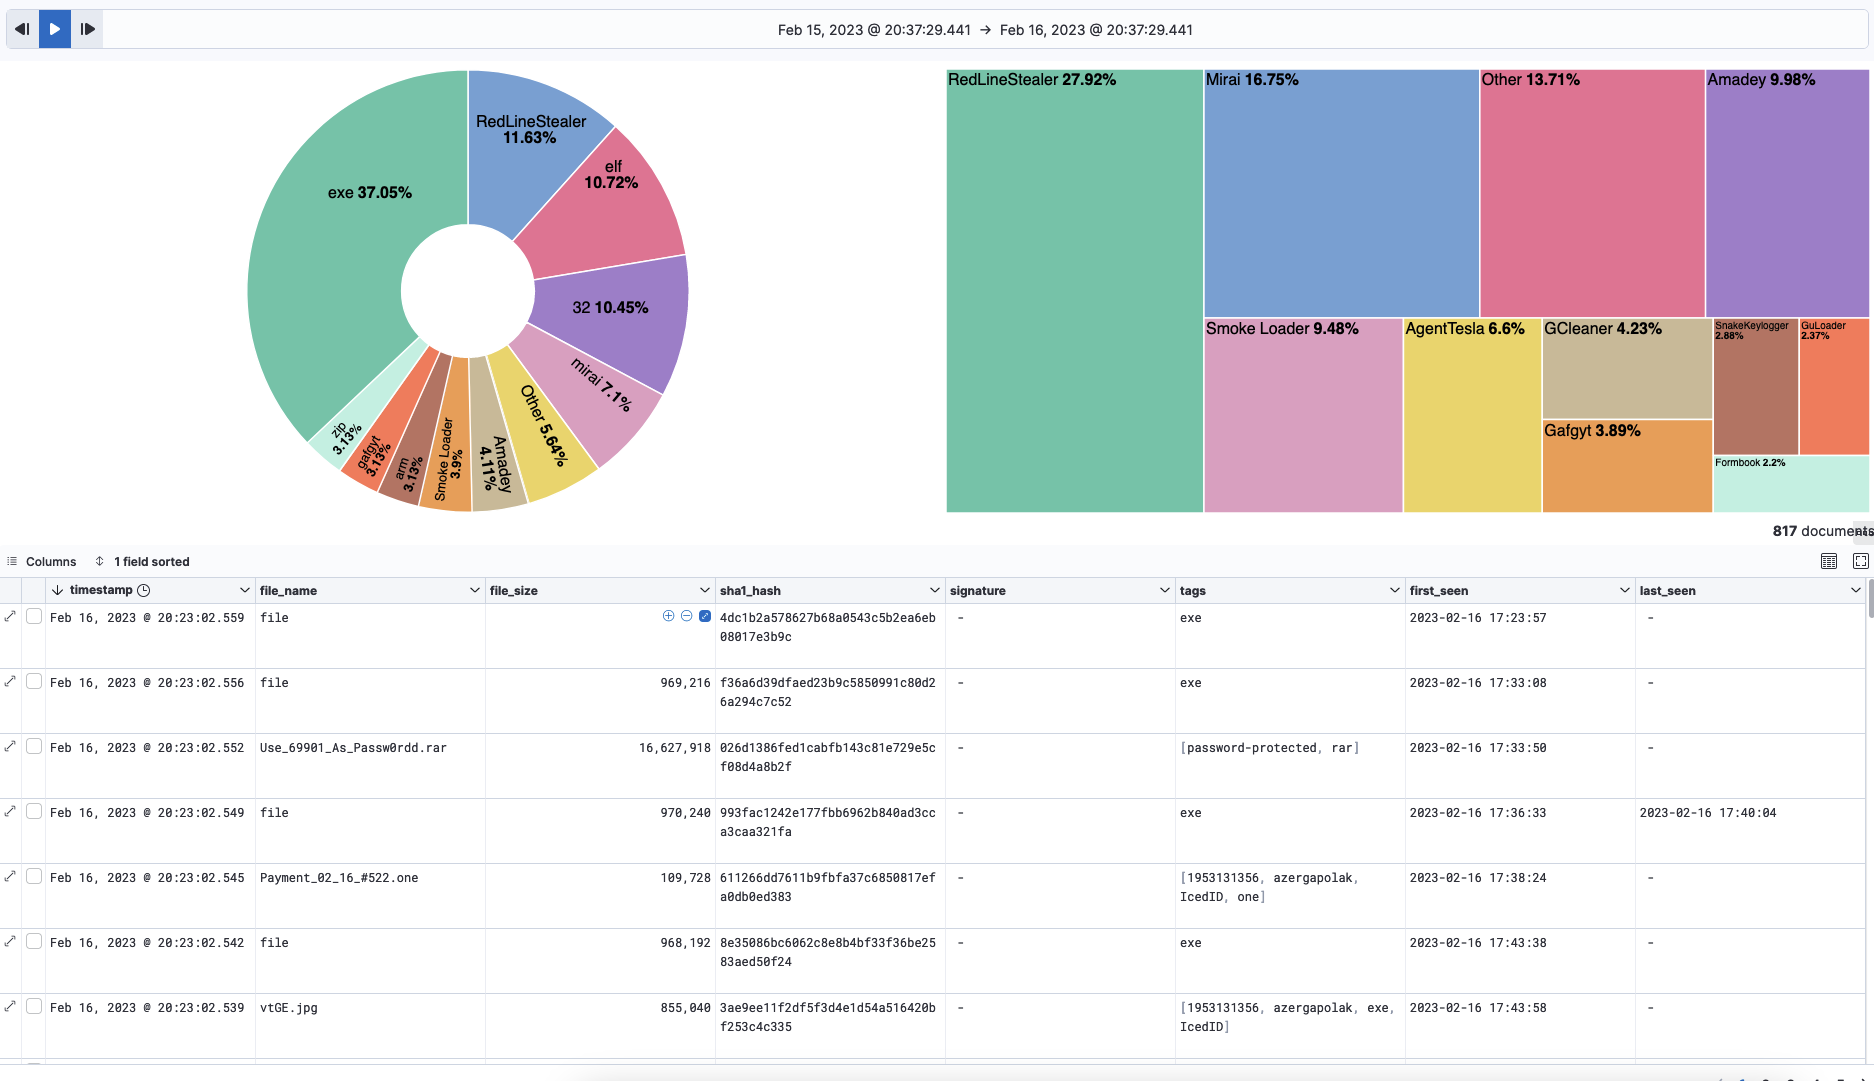
This is simple but as the Kibana offers the easy filtering and all it is quite effective. The data and the percentage of the tags & signature are showed nicely - tags on the left and signature on the right. If more details are needed those can be seen from the discover (table) below but it is quite lacking as there isn’t a ton of information there. This is still looking fine for my usage and the only issue is that it does only have the Malware Bazaar as a source. I’d rather have more data.
Looking at the VirusTotal, I think that I have no possibility to use the API to pull the stats from there, which is a shame. I did notice that Hybrid-Analysis allows for pulling data though.
Hybrid analysis
Looking at the API documentation it says that I can pull the last 250 reports. No actual times are given so if this would be critical I would need to create a duplication check to the script. However, as this just is something for my personal usage I didn’t really bother. I just scheduled the thing to run every 5 hours.
The actual code is here. You need to provide the ES server 0nce again and your API key for hybrid-analysis and otherwise it works pretty much the same as the Malware Bazaar script. I am pushing the data to a different index because the data is looking completely different.
import urllib.request
import urllib.parse
import json
from datetime import datetime
from elasticsearch import Elasticsearch
es = Elasticsearch("http://ES_host:9200")
req = urllib.request.Request('https://www.hybrid-analysis.com/api/v2/feed/latest')
req.add_header('api-key', 'your_api_key')
req.add_header('user-agent', 'Falcon Sandbox')
response = urllib.request.urlopen(req)
jsonResponse = json.loads(response.read())
for r in jsonResponse["data"]:
    r["timestamp"] = datetime.now()
    resp=es.index(index='hybrid_analysis',document=r)
    print(resp['result'])
I added this to the Crontab file as a secondary job. I am running it every 5th hour. Then I created some visualizations, once again them being extremely simple. There are further possibilities, however the data isn’t really perfect for my usage.
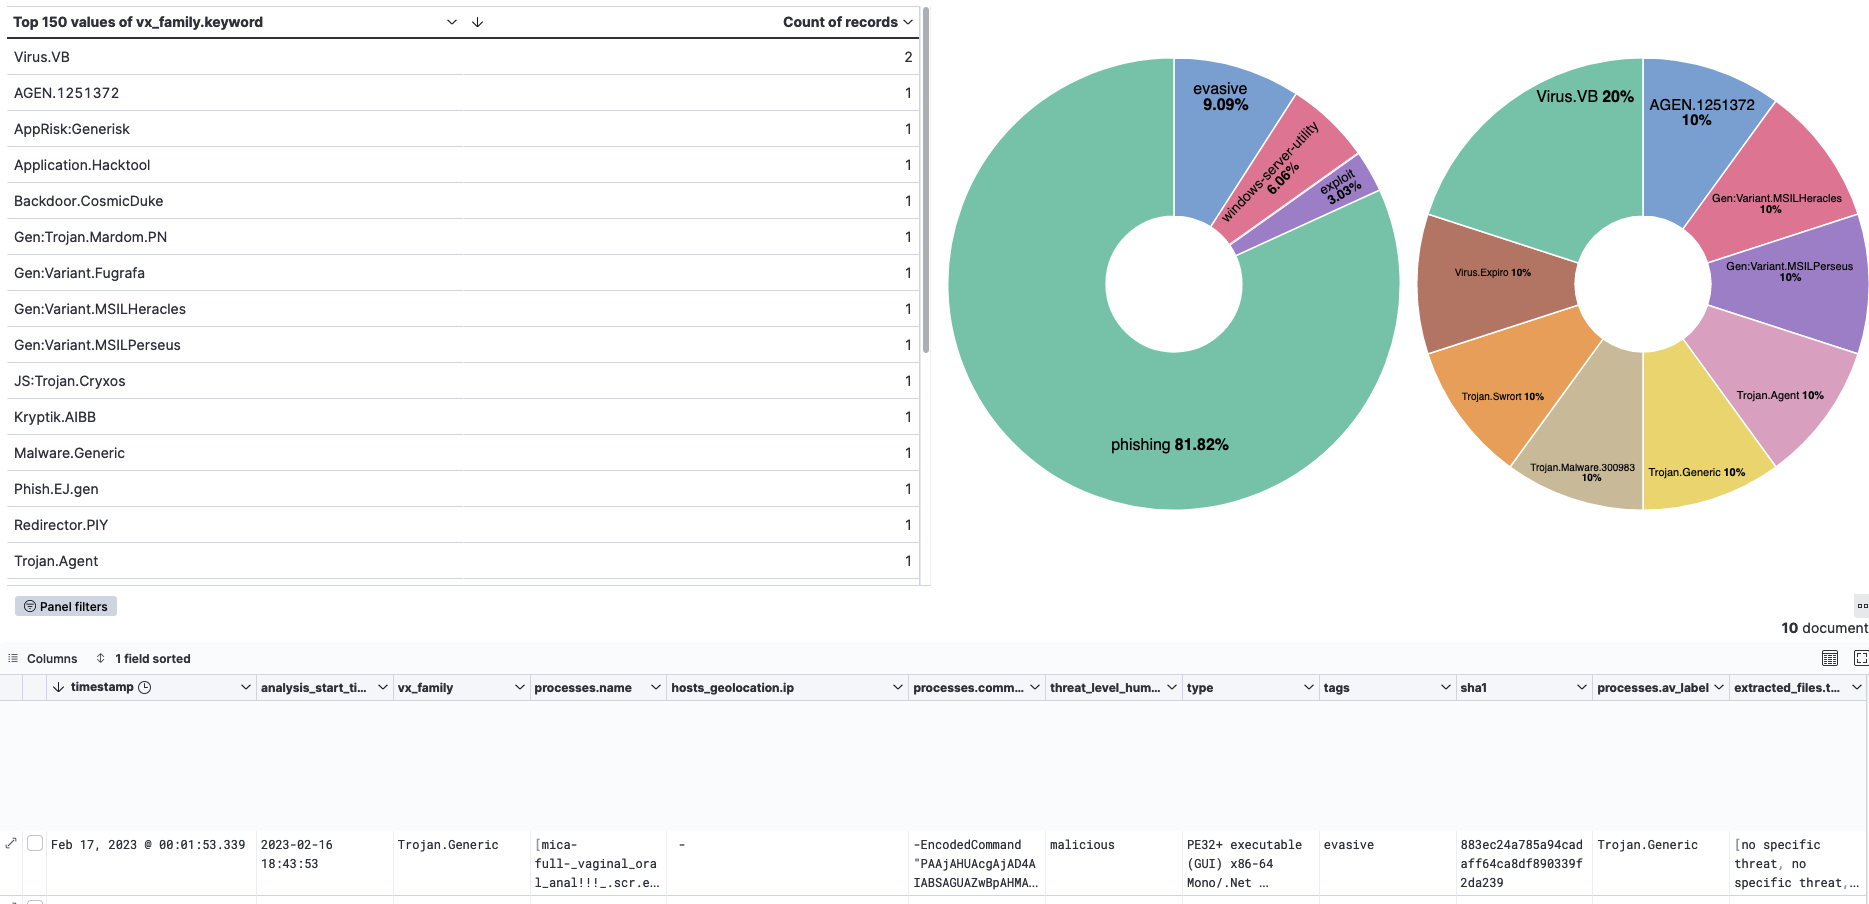
The tags for the samples are very generic at least for the current data that I have. I removed quite some generic data with filters to get something potentially meaningful from the data. Unfortunately, it ain’t much at least yet. :( Nevertheless the actual information stored for each submitted file is much better with hybrid-analysis. You get a lot of different meaningful details which is great.
This solution does not really help with my idea of getting a whiff of what are the currently active loaders for example though. So although this is very interesting data it doesn’t yet solve my problem. However, it could be that this data is enriched to be a little bit better when more data flows in from the hybrid-analysis. I don’t really think that it will be much better though so I am looking for further solutions too.
Continuing the experiment - Hatching Triage
I got access to Hatching Triage API as I was given the research permissions. Thanks to Recorded Future for granting me with the researcher access to the Hatching triage <3. I started to look into implementing the Hatching Triage data to the ELK Dashboard after I got the access. Unfortunately, I came across couple of problems while at it.
The first issue that I noted is that when using the search function on the API it does only return very general metadata of the samples. The API do not list the tags that have been observed with the sample - only much more limited data. So I had to loop through all the results and query the rest of the information with another API call. This means that there would be quite a few API calls made towards the API, but unfortunately I couldn’t think of any other solution.
The second problem that I did encounter was that the search function resulted a maximum of 50 results. First, I though this was because of pagination but increasing the results to maximum of 200 didn’t help. Or I failed miserably in using it. I didn’t play too much with it as in the end as getting more results from the first API call wouldn’t really affect the number of API calls too much - most of the API calls come from the individual sample checking. So I basically was experimenting with this and noted that I would need to run the script every 20 minutes to not get over 50 results.
Also, I needed to do some tinkering to only to get the data which I want to ELK. So I created a new dict to which I was adding only the fields that I want from the returned API calls for each of the samples. I also created a bit of an error checking to this as I am looping through each of the returned samples. I might continue this in a way which is actually pushing those error messages to ELK too, however for now this will do.
import urllib.request
import urllib.parse
import json
from datetime import datetime, timedelta
from elasticsearch import Elasticsearch
es = Elasticsearch("http://your_elk_server:9200")
# Get the current UTC time and extract 20 minutes from it
d = datetime.utcnow() - timedelta(minutes=20)
# From date filter as a string
fromdate = str(d.strftime("%Y-%m-%dT%H:%M:%S"))
req = urllib.request.Request(f'https://tria.ge/api/v0/search?query=from:{fromdate}')
req.add_header('Authorization', 'Bearer <your-api-key>')
response = urllib.request.urlopen(req)
jsonResponse = json.loads(response.read())
# Loop through the samples listed from the first API request
for r in jsonResponse["data"]:
    req = urllib.request.Request(f'https://tria.ge/api/v0/samples/{r["id"]}/summary')
    req.add_header('Authorization', 'Bearer <your-api-key>')
    resp = urllib.request.urlopen(req)
    jsonResp = json.loads(resp.read())
    # Try to push the data to ELK
    try:
        # Create a new document to push to elk, with relevant data
        doc = {
            'created': jsonResp["created"],
            'completed': jsonResp["completed"],
            'sample': jsonResp["sample"],
            'score': jsonResp["score"],
            'sha256': jsonResp["sha256"],
            'target': jsonResp["target"],
        }
        # Push behavioral1 metadata if available
        if f'{jsonResp["sample"]}-behavioral1' in jsonResp["tasks"]:
            doc["behavioral1"] = jsonResp["tasks"][f'{jsonResp["sample"]}-behavioral1']
        # Push behavioral2 metadata if available
        if f'{jsonResp["sample"]}-behavioral2' in jsonResp["tasks"]:
            doc["behavioral2"] = jsonResp["tasks"][f'{jsonResp["sample"]}-behavioral2']
        # Push static1 metadata if available
        if f'{jsonResp["sample"]}-static1' in jsonResp["tasks"]:
            doc["static1"] = jsonResp["tasks"][f'{jsonResp["sample"]}-static1']
        resp=es.index(index='triage',document=doc)
        print(resp['result'])
    except:
        print("Error in pushing data")
This results in a ton of API calls each day. I was trying to find the limits from the Hatching Triage documentation, however I was not able to do so. I wouldn’t be too surprised if this results in hitting some sort of API limit though. Hopefully though, I am not breaking any rules or anything - I really don’t want to lose the researcher permissions. :)
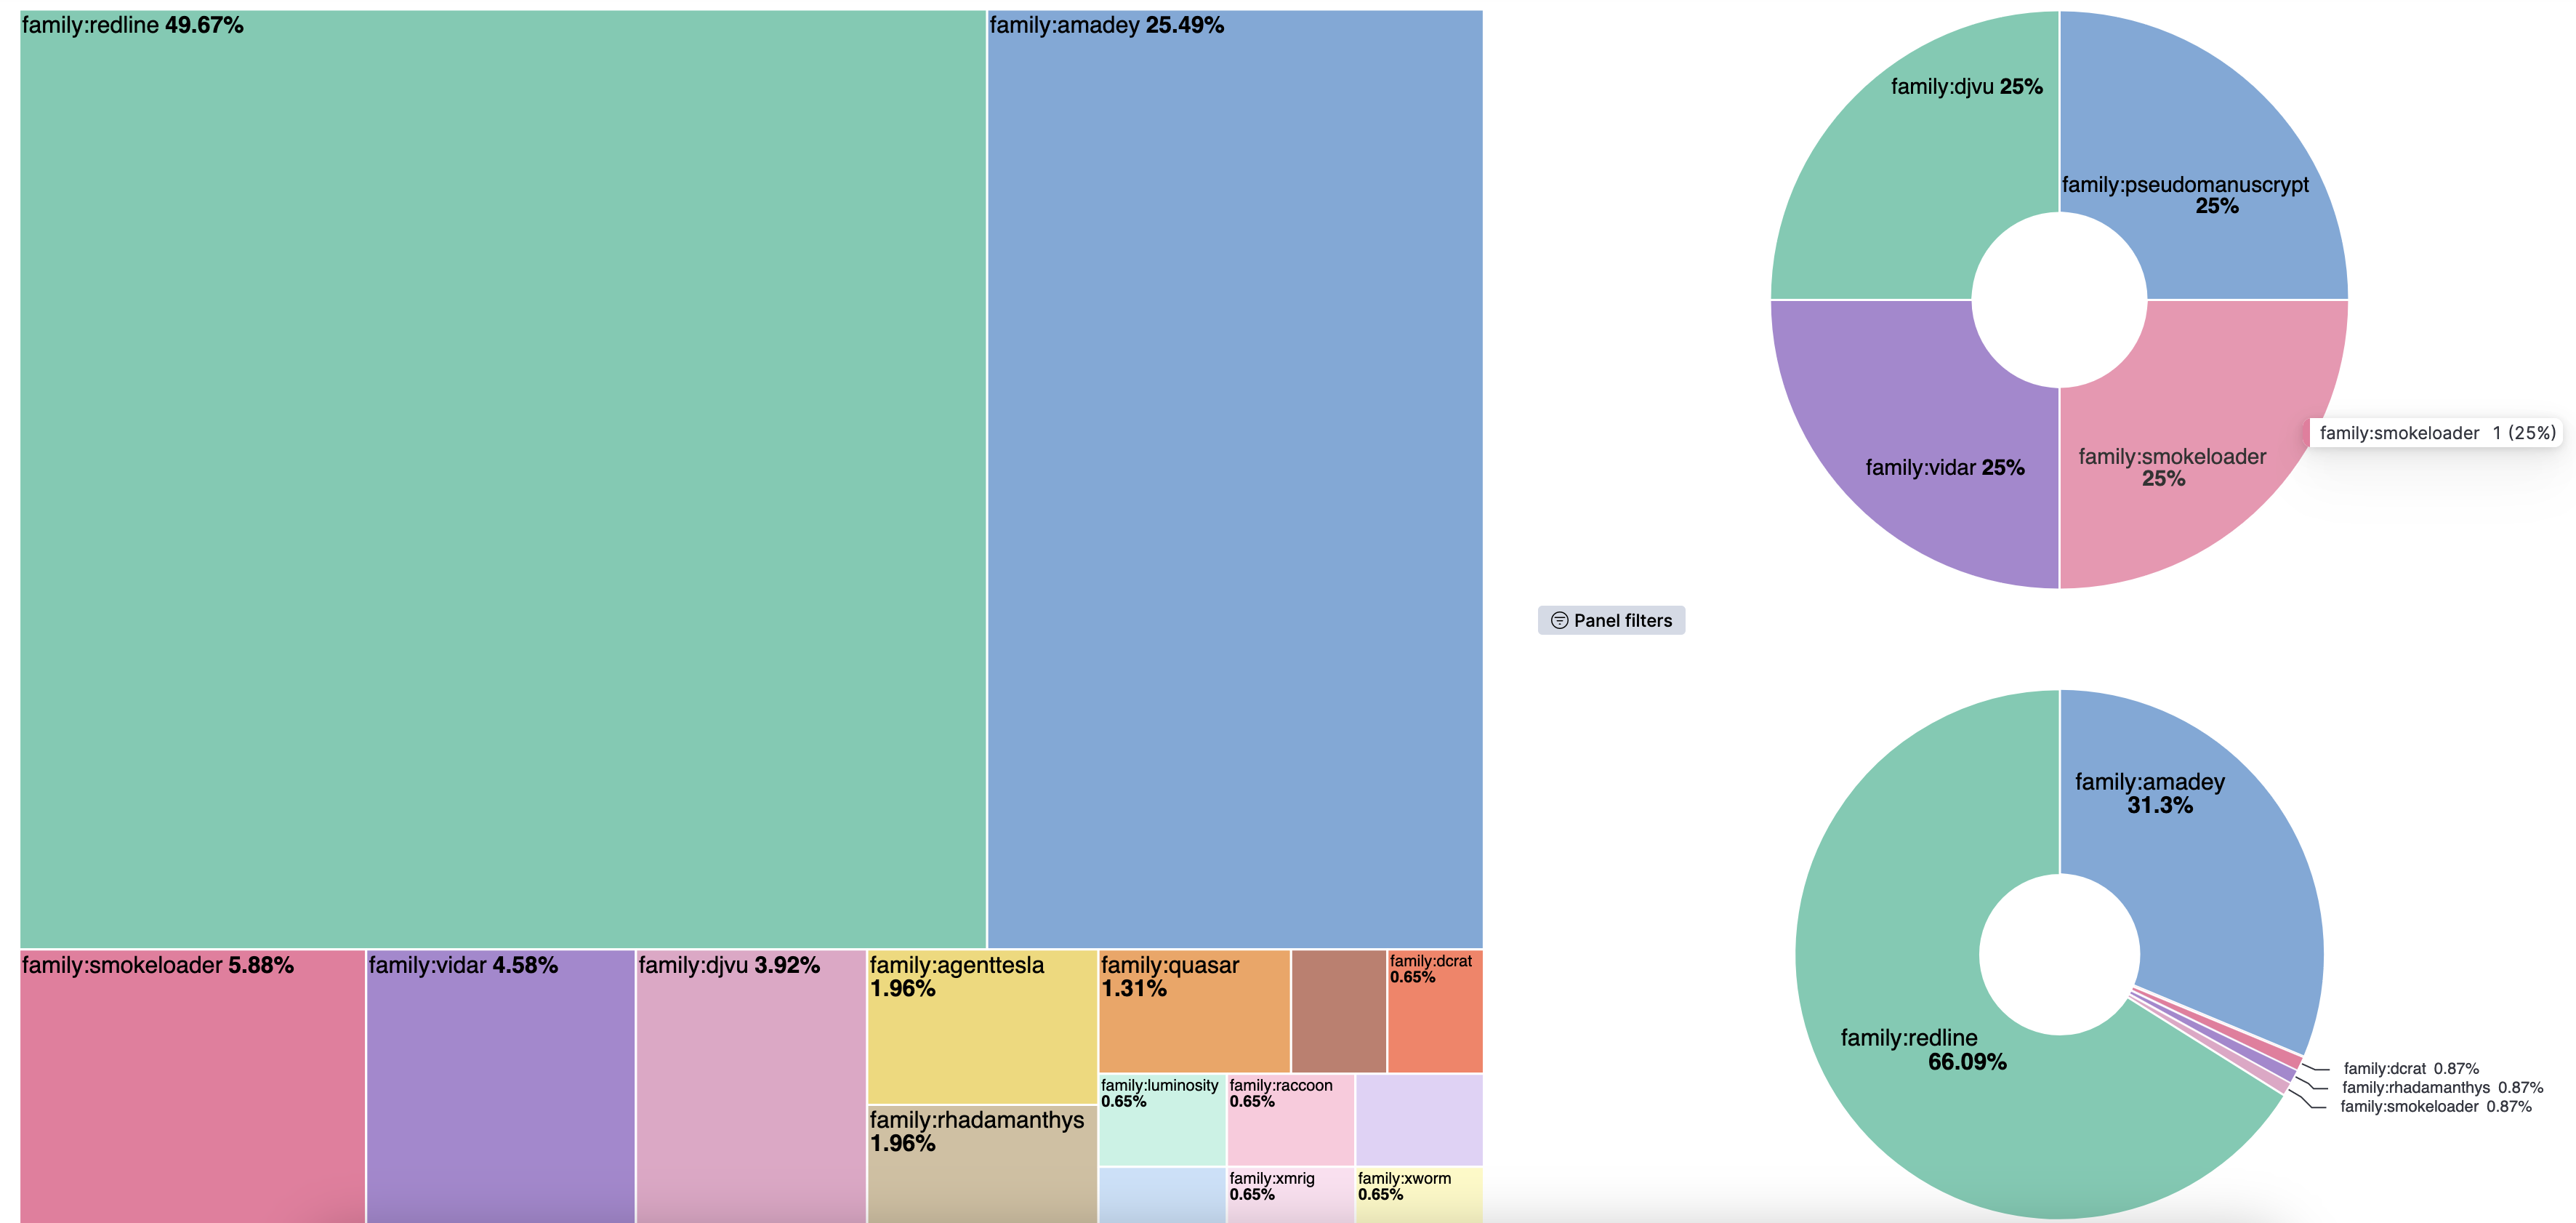
Here is my first visualizations, mostly targeting the malware families. The treemap visualization is all the families, upper pie chart is loaders and the bottom one info stealers. As you can see it is far from perfect; the tags field contain multiple tags and the family is not always tagged for the loaders, for example. I modified the visuals so that only the family tags are shown here but it needs a lot more work to be usable. However, it already is giving me a ton of information.
Visualizations
The visualization that I have created for all the three data sources are looking okay but the dashboard starts to be a little cluttered. I decided to move all the three sources to different dashboards, linking them with navigational menu. I have done the nav bar before many times on Kibana, however this time I was trying to see if it can be more visual than a simple Markdown based menu. I came across an article which described how to create a nav bar using TSVB visualization which looks a lot better than a simple MD based nav bar.
I was also fine-tuning and looking for better filters for the current visualization which I had, which revealed that the Hatching Triage really is the best data source of the three for my usage. It allows for (most easiest) way to filter and visualize only the family of the malware rather than high level groups like “generic trojan”. Also I added a timeline to the Hatching Triage dashboard to show the activity of the families in a timeline manner.
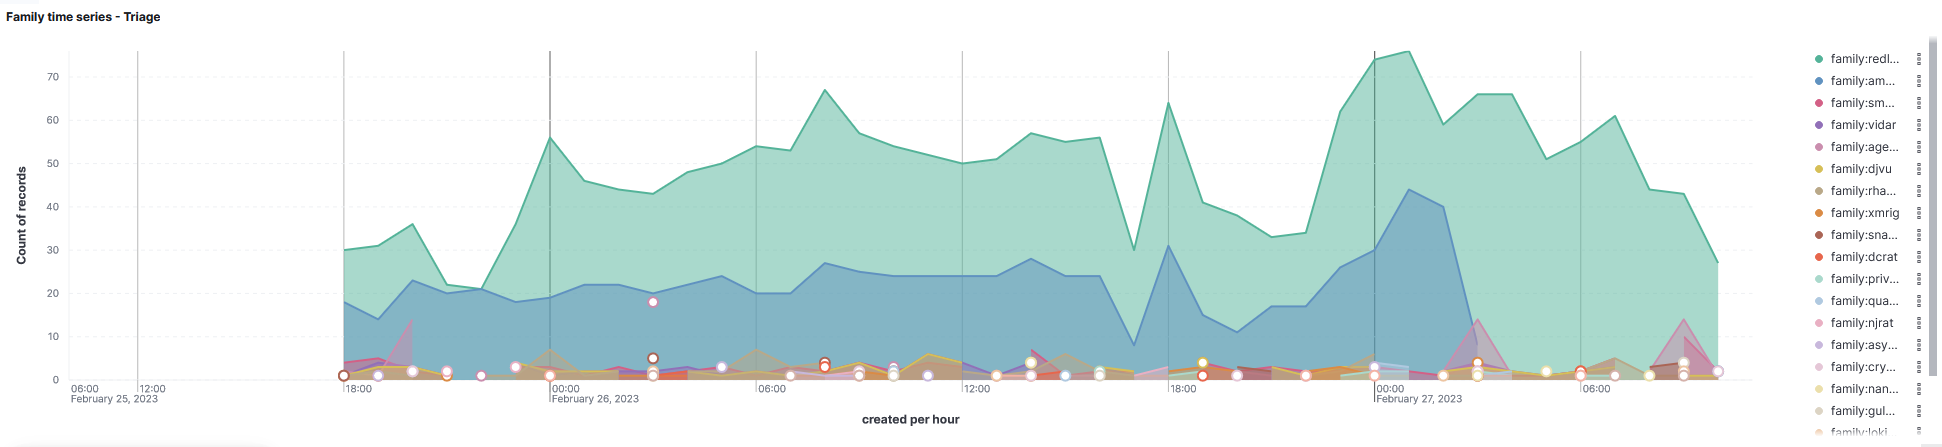
The timeline doesn’t work that nicely as a picture but with the interactive mode in Kibana you can hover your mouse over a period in the timeline to see the most active families from that period, which is VERY nice. I absolutely love this visualization myself and will likely be using it quite a lot in the future.
As I stated, I created three different dashboards with nav menu to navigate through them. Here is a GIF which quickly shows the dashboards.
I am starting to be somewhat happy with these!
Conclusion #3
Currently this allows me to take a look at the statistics from two three different engines. All of these provide different kind of view to the malicious file which have been updated to the services. All of them prove value to me - the Hatching Triage especially is amazing. It provides me (when more data flows in) a great look into different currently active malware families which was the whole point! Amazingly amazing.
The visualizations are looking quite nice too now. I like them quite a lot and might be sharing the export of the Kibana objects later on. I am not sure if they can be used only by importing so I also might NOT be sharing them. I will likely still be working with the visualizations - I love tinkering with them.
I created a fork of the GitHub repo with the changes that I made to the code(s). The same fork has the Python scripts. It is available
 Hunting for msbuild based execution