I’ve been using Jupyter Notebook for quite sometime in threat hunting and incident response purposes. It is great as it offers the python data analytic tools to be used with the data that has been ingested to it. It supports whatever that you can imagine of using over the API and thus offers great flexibility as long as you have at least some python capabilities. There are awesome tools that support the Jupyter Notebook approach like the MSTICPY from Microsoft. The MSTICPY can be used to query/hunt against several different log sources and utilizes the Jupyter Notebook capabilities quite nicely.
However, I am quite keen user of ELK too. I like ELK a lot and have used it during my DFIR teams for multiple different things. I love the visualizations that ELK can do and as such I was thinking what if I would actually combine these two? Would it bring any value over Jupyter Notebooks? The answer especially to the latter question is probably not going to get answered during this post though. I am just about to write about a technical solution how to integrated the MDE over the API so that you can create queries that can be stored in ELK. The ELK part of this post is minimal as I am no expert of building a production ready ELK and will never be.
What do you need to get this working?
- Working ELK instance
- MS Defender Advanced Hunting API access
- Some threat hunting queries I guess?
Setting up the ELK
Simple ELK setup is crazy simple to do. The whole thing can be run in a docker container and there are several variations which can be used to launch ELK. I decided to go with a ready-made solution available here. I disabled the trial and used basic version of elasticsearch by modifying the elasticsearch.yml. Otherwise, all the changes that I did related to my local configuration, like changing the .env file. I did not need persistent data for this testing, however I found a great guide configuring this from here.
I am running this on top of my server (Unraid) and starting everything remotely from there, I love to be able to run the containers on top of the thing. I can then manage them from different devices, keeping it running even if I shutdown one device. That needed a bit of tinkering within the docker-compose.yml but not much.
Running the queries and indexing them to Elasticsearch
First things first, you need to be able to run the Advanced Hunt queries somehow. This part shouldn’t be very complicated as there are different ready-made solutions for this. The only thing is that if you want to run multiple queries one after another that needs to be solved somehow. There are multiple ways how you could do this but as the idea of this is not to build the most fancy solution for this I am just storing the queries in dict. So basically, I have this part ready from my earlier blog post about Shodan. You can also get tips of creating the API keys for Defender from the same post. I only had to do some minor tweaking to get it working for this purpose, which are explained next.
The following function saves the query results returned by the API in a dict. There should be a Timestamp field available (remember not to remove this field from the queries) which is in the iso8601 format that is naturally understood by ELK as a time format. This makes it easy to index and use this field as the Timestamp field when the index pattern is created. The other fields are left for the ELK stack to interpret. In a real environment this is likely not a great idea, especially if you would like to se the integer fields as base of statistical approach of things.
# Exec mtp query copied from here: https://github.com/microsoft/Microsoft-365-Defender-Hunting-Queries/blob/master/Notebooks/M365D%20APIs%20ep3.ipynb
# Declare a function to query the M365 Defender API
# Minor changes made
def exec_mtp_query(query,aadToken):
    url = "https://api.security.microsoft.com/api/advancedhunting/run" #M365 Advanced Hunting API
    headers = {
    'Content-Type' : 'application/json',
    'Accept' : 'application/json',
    'Authorization' : "Bearer " + aadToken
    }

    data = json.dumps({ 'Query' : query }).encode("utf-8")

    req = urllib.request.Request(url, data, headers)
    response = urllib.request.urlopen(req)
    jsonResponse = json.loads(response.read())
    results = jsonResponse["Results"]
    return results
Next, the script had to be modified so that it will push the data to Elasticsearch. This could be done over a simple API call towards the Elasticsearch instance using urllib or whatever. However, I noticed that there is an official elasticsearch python client. The python client proved to be super easy to use. First, set the ES instance and then start sending data. Didn’t really bother to explore much of the authentication or other “advanced” features, as I am running unauthenticated version at home. It is possible that there are some missing functions which make it hard(er) to use in a production environment.
Anyway, the script is super simple in the end. In the following code the queries are stored in a dict which are then looped through to launch the queries against the MDE API and then the results are stored in the Elasticsearch. I also added the query name to the dict so that it is easier to see which query gave which results.
#Add the filters to a dict
#Follow the same format to add your own queries.
queries = {
    'AADSpnSignInEventsBeta_testing': f'AADSpnSignInEventsBeta | where Timestamp > ago(30d)',
    'EmailUrlInfo_testing': f'EmailUrlInfo| where Timestamp > ago(30d)'
}

#Authenticate to the MDE API.
aadToken = app_auth(Client_id,Client_secret,TenantId)

#Run the queries stored in the queries dict, one by one.
for a in queries:
    results = exec_mtp_query(queries[a],aadToken)
    if results:
        for r in results:
            r['query_name'] = a
            resp = es.index(index="mde_data", document=r)
            print(resp['result'])
    else:
        print("Dict is empty, no results for the query " + a)
The full script is available here.
Kibana
Next step is to launch Kibana and to create a new Data View. As the index name is mde_data it could for example look something like this:
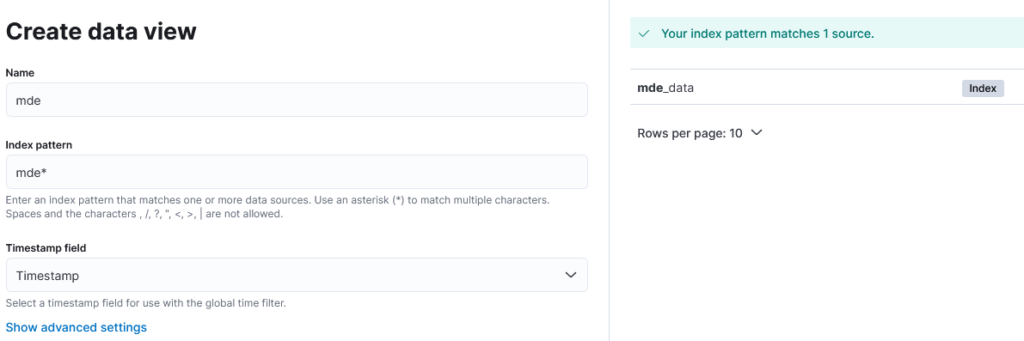
This should now parse the Timestamp field nicely and it also formatted all the numerical fields which were part of the data correctly. You don’t need to know all the field names here (thankfully as there are quite some in MDE, especially if you are like me and like to rename the fields in the queries to make them more logical) to be able to ingest the data. I am sure that pretty much all the things would be eaten up to the elasticsearch nicely.
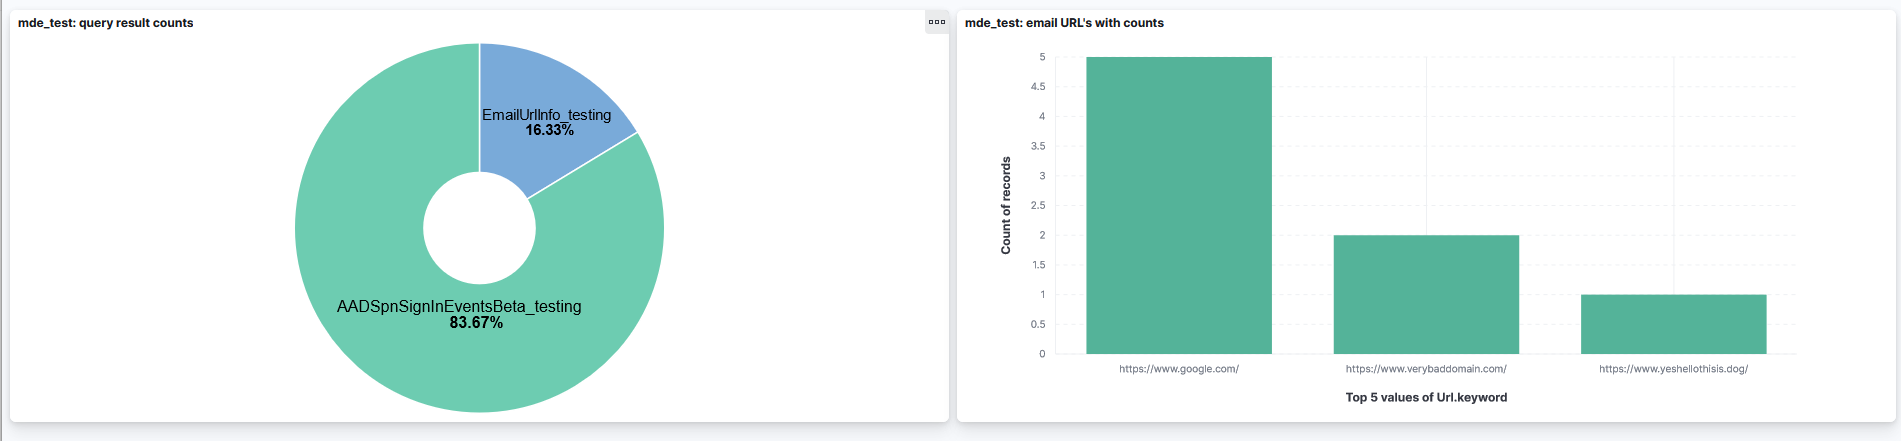
As I currently don’t have active MDE license the demo visuals are created from some email/authentication data which is why they are quite lame. With actual MDE data and some fancy threat hunting queries this could look much better. I myself just love setting up the visuals and always enjoy that. If you are like me and also using MDE for threat hunting this might be something that you might be able to use.
Conclusion
Why? Why would you do this instead of using Jupyter Notebook and the visualizations there? Well. So far as much as I like Jupyter Notebooks the interactive tables that I’ve used are much more cumbersome to use than the Discover feature of Kibana. I like the discover of Kibana quite a lot. Also the visualizations are (to me) easier to approach over Kibana than with Jupyter Notebooks. Also, when you are starting to get lot of data to Jupyter Notebooks the performance isn’t the best anymore.
All in all, I think ELK can potentially be a better solution for ingesting the data from threat hunting queries. It is, however, more limited than using the good ol’ Jupyter Notebook and data analysis tools that Python can offer. ELK offers more persistent data as it is stored in the Elasticsearch database - if you need to revisit the data it might be a good idea to store it in ELK. I think though, there would be room for both options - maybe store the data in ELK and use Jupyter Notebook for hunting - or use whatever suits the task better. I also might continue this later if I get inspiration to build some better dashboards or whatever.
Thanks for reading!
Github link to the script:
https://github.com/JouniMi/Threathunt.blog/blob/main/mde_to_elk.py
 Qakbot