When the attackers have been able to gain initial access to the environment they are often running different kind of commands to gain further information of the environment. The commands that are being run are often the same in the attacks thus making it possible to hunt for these commands being run on a quick succession.
The issue with the approach is that there is a ton of legitimate processes that are doing exactly the same. The commands are the same and there are many legitimate reasons to run them within a short period of time. This makes hunting a little more interesting, how to actually spot the anomalous instances from the legitimate actions? This can be partly accommodated within the queries, however the point of threat hunting is that there is analysis done against the data. If the queries are able to pick up the anomalies reliably, why not turn the queries as detection rules?
The discovery commands are often being run on a very early stage of the attack after gaining the initial access. Qbot, IcedID and the others are running at least some discovery commands to gain further information from the environment after their initial payload has been executed. This makes this a great target for threat hunting, the earlier the attack can be spotted the better. Unfortunately, the amount of the commands that are actually being run is not as high as one would hope, in some examples only couple of commands have been actually executed - this makes finding the actual anomalies a little challenging.
Getting started with the query, I am using some of the most commonly seen commands as an example here. There are many others that could be included. I am using the DeviceProcessEvents table and the has_any operator to limit to the discovery process launches. I was thinking on how to count the amount of launches in short period of time (1 minute in this case) . First, I limited the results to only a single parent process which makes creating the query a lot easier. At this stage, I just wanted to get the counts.
DeviceProcessEvents
| where FileName has_any ("nslookup.exe","net.exe","ipconfig.exe","nltest.exe","systeminfo.exe","wmic.exe","ping.exe")
| summarize count() by DeviceName,InitiatingProcessFileName,InitiatingProcessCreationTime,InitiatingProcessId,bin(Timestamp, 1m)
After getting the counts I can join the data to get more details. Now I just used a simple join without thinking too much what join flavor should be used, although I guess this works fine. I also add a limitation so that only the instances where there has been more than 5 occurrences will be returned.
DeviceProcessEvents
| where FileName has_any ("nslookup.exe","net.exe","ipconfig.exe","nltest.exe","systeminfo.exe","wmic.exe","ping.exe")
| summarize count() by DeviceName,InitiatingProcessFileName,InitiatingProcessCreationTime,InitiatingProcessId,bin(Timestamp, 1m)
| where count_ > 5
| join (
DeviceProcessEvents
| where FileName has_any ("nslookup.exe","net.exe","ipconfig.exe","nltest.exe","systeminfo.exe","wmic.exe","ping.exe")
) on DeviceName,InitiatingProcessFileName,InitiatingProcessCreationTime,InitiatingProcessId
| project DeviceName, Timestamp, Timestamp1, count_, FileName, ProcessCommandLine, InitiatingProcessFileName, InitiatingProcessParentFileName
| sort by DeviceName, count_, Timestamp
This query works fine although - for example - the senseir.exe has to be excluded from the results as MDE is running the commands as of itself. The problem with this approach is that it limits the results to a single parent process. This might be sometimes desirable, however often in the actual attacks the process launching the commands might change. The first approach that I thought of to handle the potentially changing processes is to do the join on time basis. The approach for a time based join has been documented nicely in the KQL documentation: https://docs.microsoft.com/en-us/azure/data-explorer/kusto/query/join-timewindow.
let lookupWindow = 1min;
let lookupBin = lookupWindow / 2.0;
DeviceProcessEvents
| where FileName has_any ("nslookup.exe","net.exe","ipconfig.exe","nltest.exe","systeminfo.exe","wmic.exe","ping.exe")
| summarize count() by DeviceName,bin(Timestamp, 1m)
| where count_ > 5
| extend AnomalyStartTime = Timestamp
| extend TimeKey = bin(Timestamp, lookupBin)
| join (
DeviceProcessEvents
| where FileName has_any ("nslookup.exe","net.exe","ipconfig.exe","nltest.exe","systeminfo.exe","wmic.exe","ping.exe")
| extend ProcessLaunchTime = Timestamp
| extend TimeKey = range(bin(Timestamp-lookupWindow, lookupBin),
                              bin(Timestamp, lookupBin),
                              lookupBin)
| mv-expand TimeKey to typeof(datetime)
) on DeviceName, TimeKey
| where (ProcessLaunchTime - AnomalyStartTime) between (0m .. lookupWindow)
| project DeviceName, Timestamp, Timestamp1, count_, FileName, ProcessCommandLine, InitiatingProcessFileName, InitiatingProcessParentFileName
| sort by DeviceName, count_, Timestamp
With this query the results should be visible even if the process launching the commands changes. In reality, this can turn the query to be relatively impossible to run though. There will likely be a huge amount of false-positives in real environments. Likely needs quite a lot of tinkering to make it more efficient and to rule out false-positives - this might work in more static environment just by ruling out the processes that do cause the noise.
To test this out I decided to run couple of commands with cmd and some more with powershell. I run three commands with powershell and another 3 with cmd. I also increased the value of the summarize to 5 minutes because of how bin works. It rounds the values down to an integer, for example 10:50 and with 1 minutes join it shows only events from 10:50-10:51. With increasing the value to 5 minutes it covers the anomalies more reliably, unfortunately in reality this isn’t a perfect approach. There probably is a better one, which I don’t know of. Anyway, here is the current query.
let lookupWindow = 5min;
let lookupBin = lookupWindow / 2.0;
DeviceProcessEvents
| where InitiatingProcessParentFileName != @"SenseIR.exe"
| where FileName has_any ("nslookup.exe","net.exe","ipconfig.exe","nltest.exe","systeminfo.exe","wmic.exe","ping.exe")
| summarize count() by DeviceName,bin(Timestamp, 5m)
| where count_ > 5
| extend AnomalyStartTime = Timestamp
| extend TimeKey = bin(Timestamp, lookupBin)
| join (
DeviceProcessEvents
| where InitiatingProcessParentFileName != @"SenseIR.exe"
| where FileName has_any ("nslookup.exe","net.exe","ipconfig.exe","nltest.exe","systeminfo.exe","wmic.exe","ping.exe")
| extend ProcessLaunchTime = Timestamp
| extend TimeKey = range(bin(Timestamp-lookupWindow, lookupBin),
                              bin(Timestamp, lookupBin),
                              lookupBin)
| mv-expand TimeKey to typeof(datetime)
) on DeviceName, TimeKey
| where (ProcessLaunchTime - AnomalyStartTime) between (0m .. lookupWindow)
| project DeviceName, AnomalyStartTime, ProcessLaunchTime, count_, FileName, ProcessCommandLine, InitiatingProcessFileName, InitiatingProcessCommandLine, InitiatingProcessParentFileName
| sort by DeviceName, count_, Timestamp
Results of the test I ran, 3 commands initiated with cmd.exe and 3 with powershell.
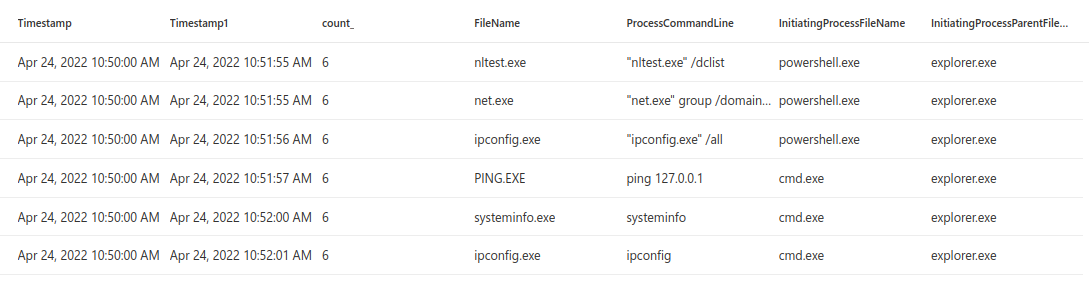 Results from both processes running the discovery commands.
So this sort of works, although I forgot to change the field names on the output, oops. I corrected this to the original query with also adding the commandline for the initiating process. This also currently covers only a portion of the commands that the attackers like to run, although these are some of the most common ones. In reality, depending on the environment, this might be causing so much of noise that it is unusable. Usually this is caused by same command being run multiple times in a row.
The next query tries to remove the results where the same binary/command has been run in a row. I am using materialize to cache the results from the first join so that I can join back to the cached data instead of making a new query. This way I can use the AnomalyStartTime column for joining purposes. This of course is somewhat untrustworthy as there can be unrelated processes launching stuff at the same time which can mess up the results.
let lookupWindow = 5min;
let lookupBin = lookupWindow / 2.0;
let GetTheEvents = materialize (
DeviceProcessEvents
| where InitiatingProcessParentFileName != @"SenseIR.exe"
| where FileName has_any ("nslookup.exe","net.exe","ipconfig.exe","nltest.exe","systeminfo.exe","wmic.exe","ping.exe")
| summarize count() by DeviceName,bin(Timestamp, 5m)
| extend AnomalyStartTime = Timestamp
| extend TimeKey = bin(Timestamp, lookupBin)
| where count_ > 5
| join (
DeviceProcessEvents
| where InitiatingProcessParentFileName != @"SenseIR.exe"
| where FileName has_any ("nslookup.exe","net.exe","ipconfig.exe","nltest.exe","systeminfo.exe","wmic.exe","ping.exe")
| extend ProcessLaunchTime = Timestamp
| extend TimeKey = range(bin(Timestamp-lookupWindow, lookupBin), bin(Timestamp, lookupBin), lookupBin)
| mv-expand TimeKey to typeof(datetime)
) on DeviceName, TimeKey
);
GetTheEvents
| summarize proccount = count() by FileName, count_, DeviceName, AnomalyStartTime
| where proccount != count_
| join kind=inner GetTheEvents on FileName, count_, DeviceName, AnomalyStartTime
| project DeviceName, FileName, AnomalyStartTime, count_, proccount, ProcessCommandLine, InitiatingProcessFileName, InitiatingProcessFolderPath, InitiatingProcessCommandLine, InitiatingProcessParentFileName
| sort by AnomalyStartTime, DeviceName
I tested this by launching ipconfig couple of times in a row. Then I ran the query.
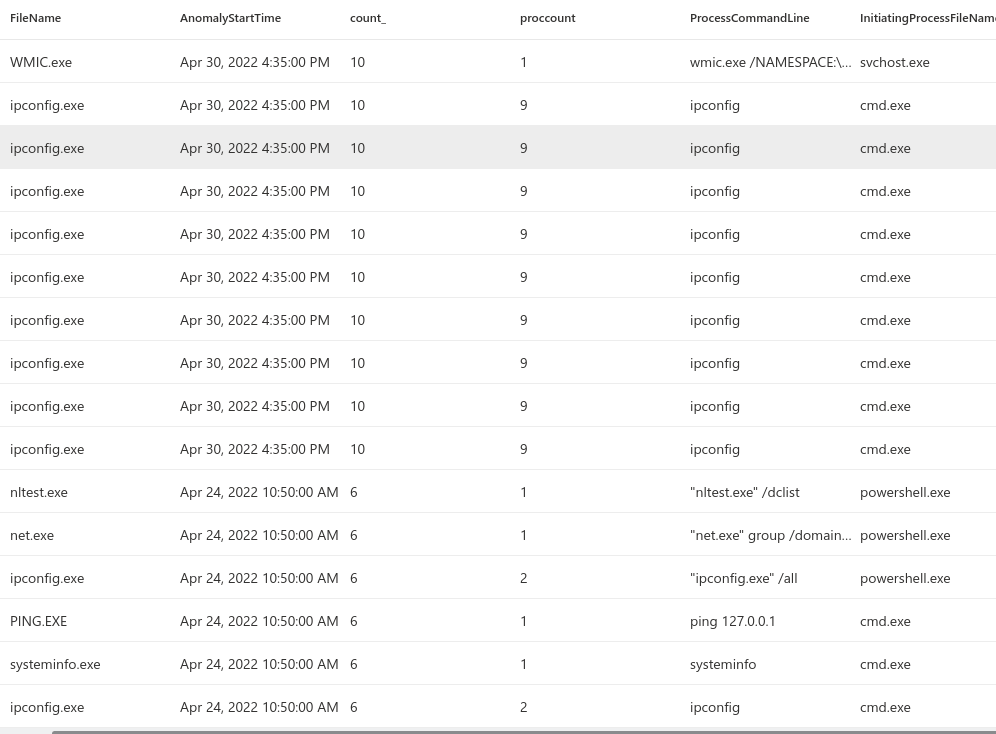 The ipconfigs are shown in the output. Damn.
The output does include the ran IPconfig as the count_ does not match the proccount. The reason for this is that svchost.exe was starting the process WMIC.exe at the same time which was not initiated by me. So this does not work if there are other processes launching the same binaries and makes this quite untrustworthy. I think this should still work with the first query where it is expected that a single process will launch all the discovery commands. So I modified the first one which then looked like this
let GetTheEvents = materialize (
DeviceProcessEvents
| where InitiatingProcessParentFileName != @"SenseIR.exe"
| where FileName has_any ("nslookup.exe","net.exe","ipconfig.exe","nltest.exe","systeminfo.exe","wmic.exe","ping.exe")
| summarize count() by DeviceName,FileName,InitiatingProcessFileName,InitiatingProcessCreationTime,InitiatingProcessId,bin(Timestamp, 5m)
| where count_ > 5
| extend AnomalyStartTime = Timestamp
| join (
DeviceProcessEvents
| where FileName has_any ("nslookup.exe","net.exe","ipconfig.exe","nltest.exe","systeminfo.exe","wmic.exe","ping.exe")
) on DeviceName,InitiatingProcessFileName,InitiatingProcessCreationTime,InitiatingProcessId
| project DeviceName, Timestamp, count_, FileName, ProcessCommandLine, InitiatingProcessFileName, InitiatingProcessCommandLine, InitiatingProcessParentFileName, AnomalyStartTime, ProcessStartTime = Timestamp1
);
GetTheEvents
| summarize proccount = count() by FileName, count_, DeviceName, AnomalyStartTime
| where proccount != count_
| join kind=inner GetTheEvents on FileName, count_, DeviceName, AnomalyStartTime
| sort by DeviceName, count_, Timestamp
Now the output seems to be correct, the ipconfig which I ran multiple times in a row is missing so it is filtered out. I still have no idea if this works in a live environment or not as I haven’t been able to test it. Or I guess it works but it might still cause whole lot of noise and the time based version will also cause issues as non-related processes will be running the same commands at the same time.
| Once again, a relatively simple idea in my head seems to be a little bit hard to do in reality. I am sure that this is doable and I am a little stuck in my ways and there would be some grand way with KQL to do this more efficiently. It would be possible to limit the amount of same command being run by using the between operator instead of != in the final where clause. For example: _ | where proccount !between ((count_/2) .. count_)_ might work better. Only testing in the actual environment would tell how well this works. |
 DLL image loads from suspicious locations by regsvr32.exe / rundll32.exe