 Jouni
Jouni 
The architecture changes
The third part of the series, which comes with a bit of a latency, where I’ll explore a couple of things: the GUI and the additional agents I’ve built. I actually rebuilt the whole architecture before introducing the GUI; it’s now using a custom stack centered around ClickHouse and detection rules built directly on top of it.
I used to run the standard routine: OpenSearch for the SIEM and Tracecat for the SOAR. It worked, but honestly, it felt like fighting a dinosaur. I wanted something actually AI-native, not just a stack with some AI plugins bolted on. To really lean into GenAI and machine learning, I needed a data lake that could handle massive scale without choking, which is why I ripped everything out and moved to ClickHouse. It gives me the raw performance and flexibility I need to feed models without spending half my day writing complex queries just to get a decent dataset.
The detection side is where this thing actually gets fast. I built the rules as ClickHouse Materialized Views that watch the main event table. The second a matching event hits the disk, the MV fires and shoves it into an alerts table.
The secret sauce here is using RawBLOB for ingestion. Every event lands as a raw JSON string, meaning I have zero parse failures at the door. I then use MATERIALIZED columns to extract fields on the fly. If a mapping is wrong, I don’t restart the pipeline; I just run an ALTER TABLE to fix the logic. Did I mention that ClickHouse efficiently compresses the data with around 1:10 ratio in my environment? Currently I have ingested around 66GB of raw logs which takes 6,68GB of disk space compressed. The architecture supports S3 tiering for cold storage, which would reduce the data storage costs further.

From there, I’ve got a correlation engine that polls those alerts and groups them into actual incidents before pushing them into TheHive. It’s a pretty straightforward flow, but it beats the hell out of waiting for a scheduled query to tell me I’m getting breached. Every table, every Materialized View, and every detection rule lives in Git. I can push a change to my init.sql, let the CI/CD pipeline handle the deployment, and know exactly what’s running in production. I vibe coded a solution which took the existing Sigma rules and turned them into SQL-based rules and deployed all of them to prod with the pipeline. I think it was around 1000 rules in total.
The architecture looks something like this:
[ Endpoints ] ──(Fluent Bit)──► [ Kafka ] ──(RawBLOB)──► [ ClickHouse ]
                                                              │
                                                              │ (Materialized Views)
                                                              ▼
 [ TheHive ] ◄── [ Correlation Engine ] ◄── [ soc.alerts ] ◄──┘
      ▲                                           ▲
      │                                           │
      └────────────────── [ ML Scoring ] ─────────┘
                                  │
                                  ▼
                             [ Grafana ]
The Command center (GUI)
The underlying SOC agent is pretty similar, just adapted to use TheHive instead of Tracecat (nothing wrong with Tracecat, love it still!). However, I have created a GUI which brings things together and enhances some of the capabilities. It is also partially helping to extend the platform to further agents.
I built the GUI to be the single pane of glass where I can see the agent’s thought process and the results in real-time. It’s not a polished corporate product, but it does exactly what I need. I’ve integrated everything from Defender remediation, where I can isolate a host with one click, to a full-blown tuning dashboard. One amazing addition is the tuning part. The analysis agent votes on which alerts to tune, suggests how to kill a noisy alert, and creates the modifications to the SQL detection rule directly. I also added an option to create a separate report for each incident as needed, where the AI agent analyzes the incident and writes a thorough report.
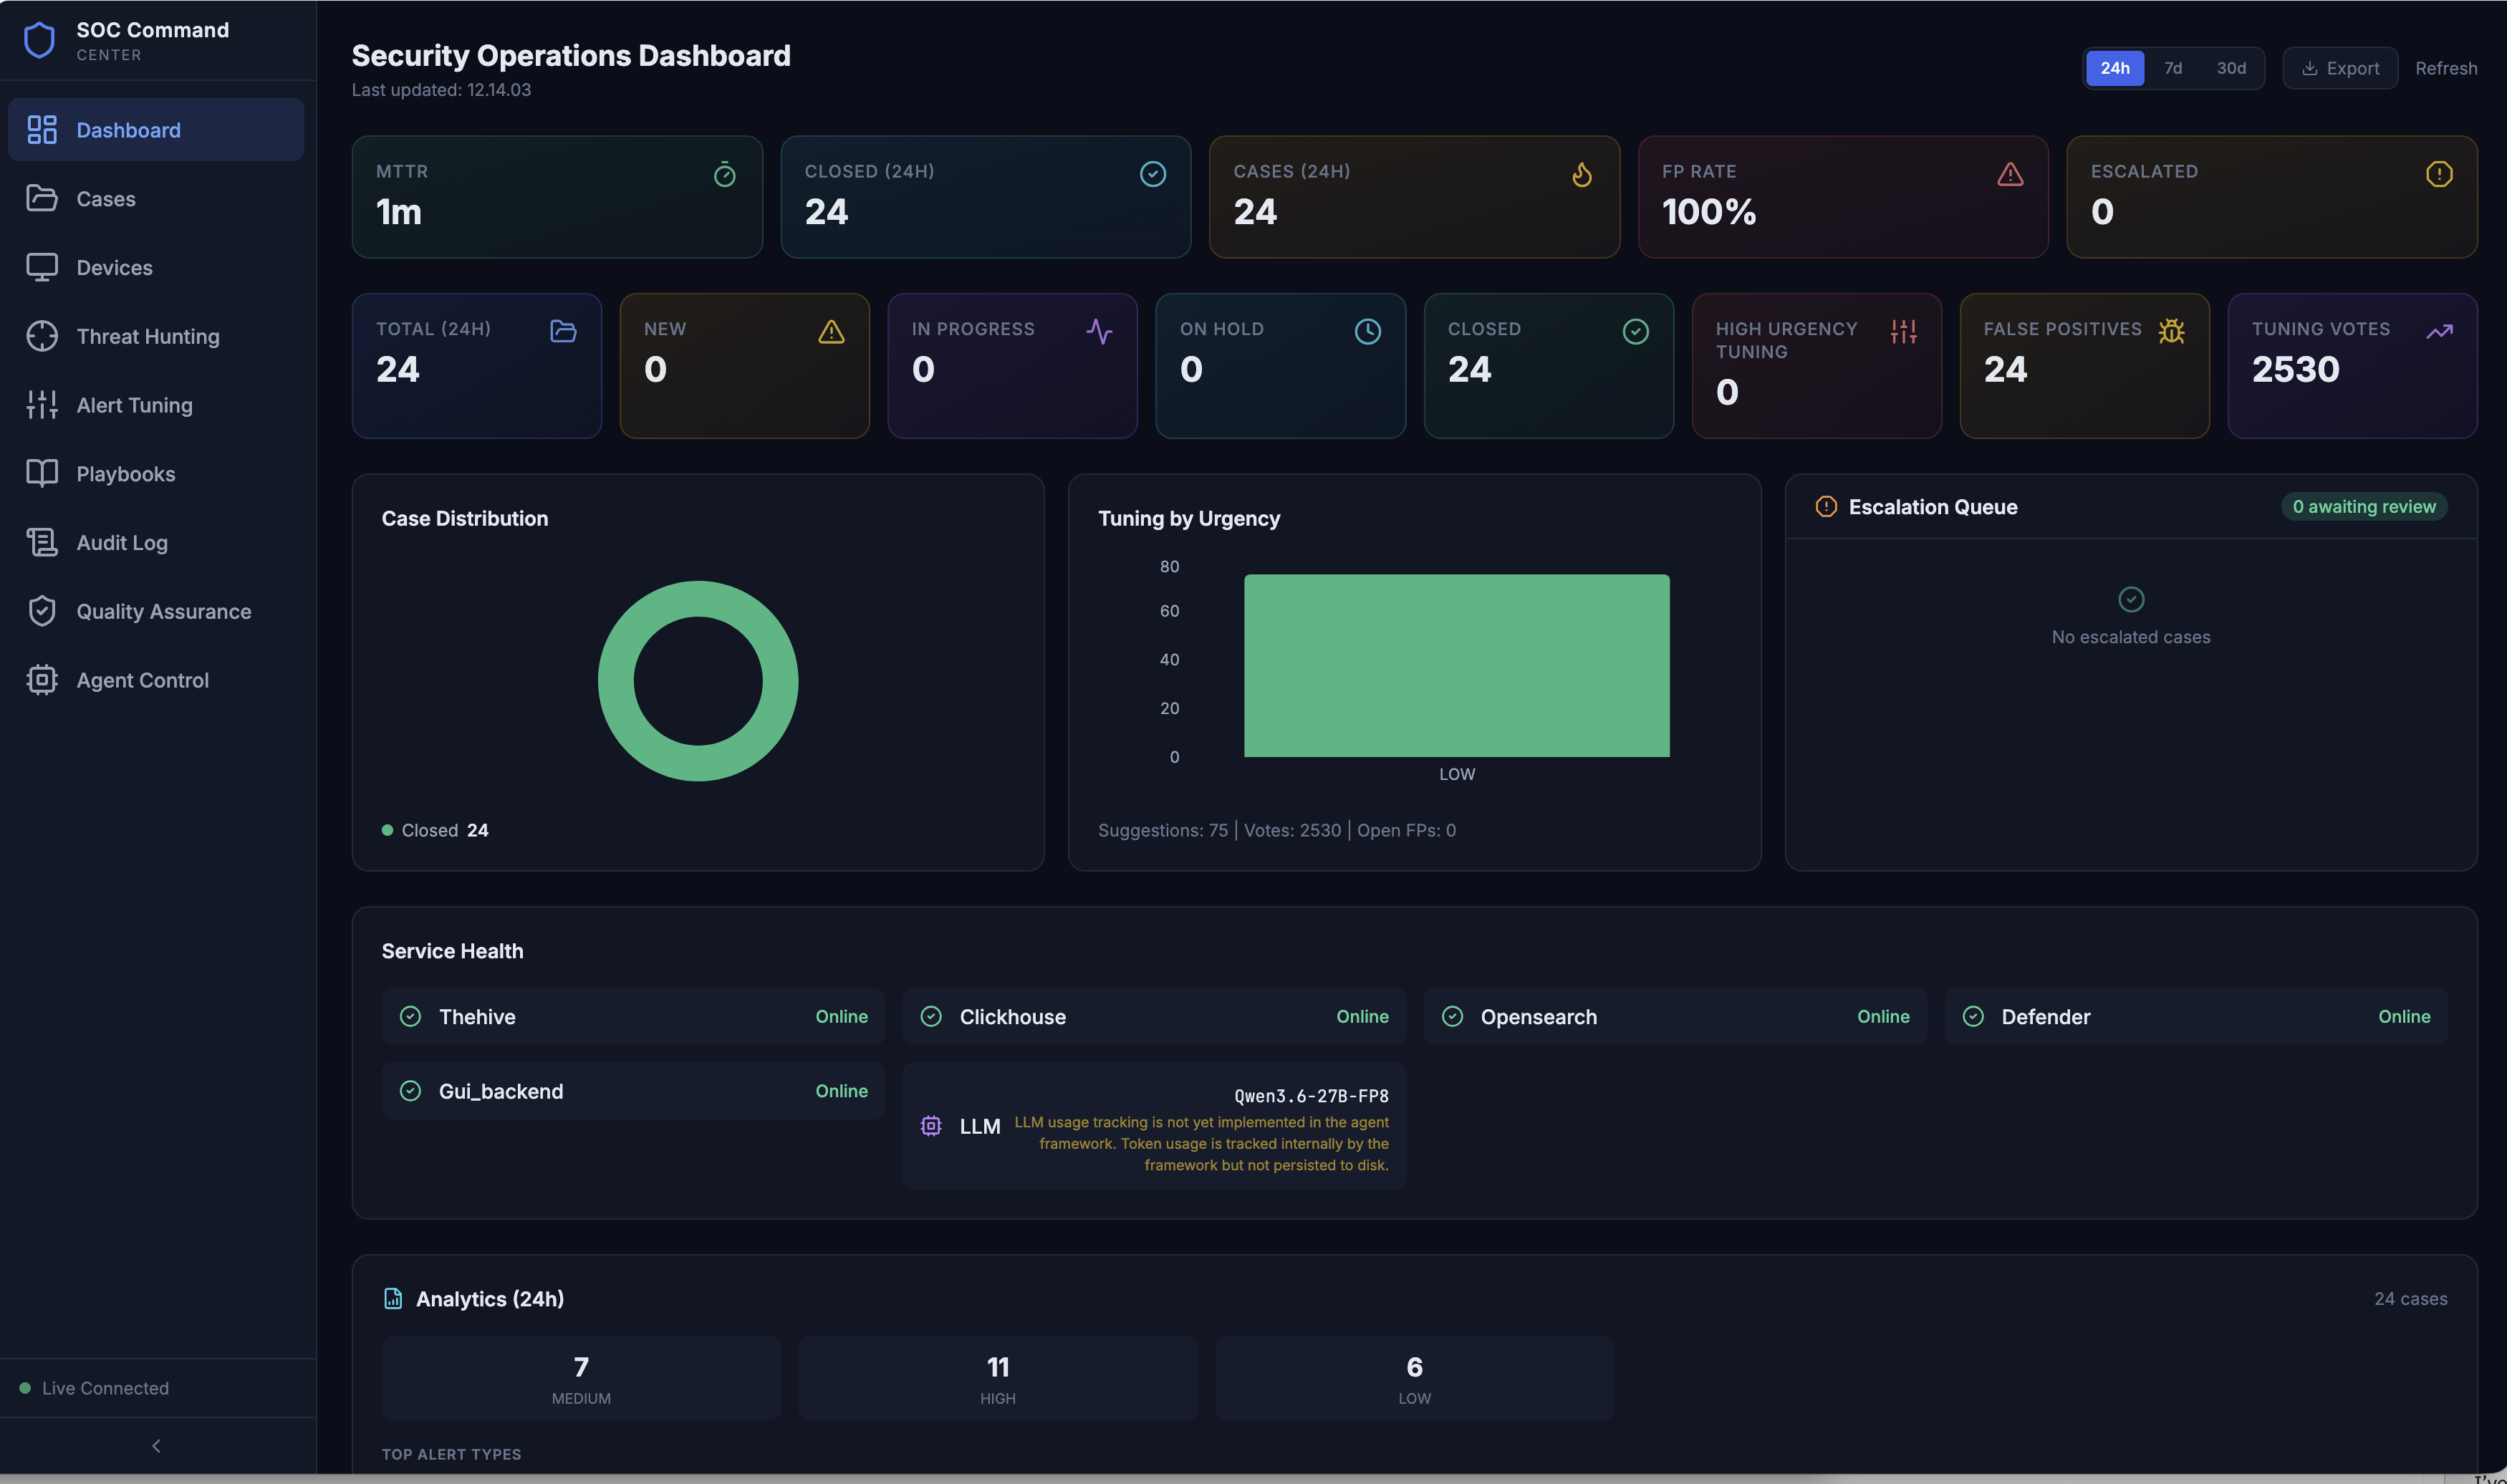
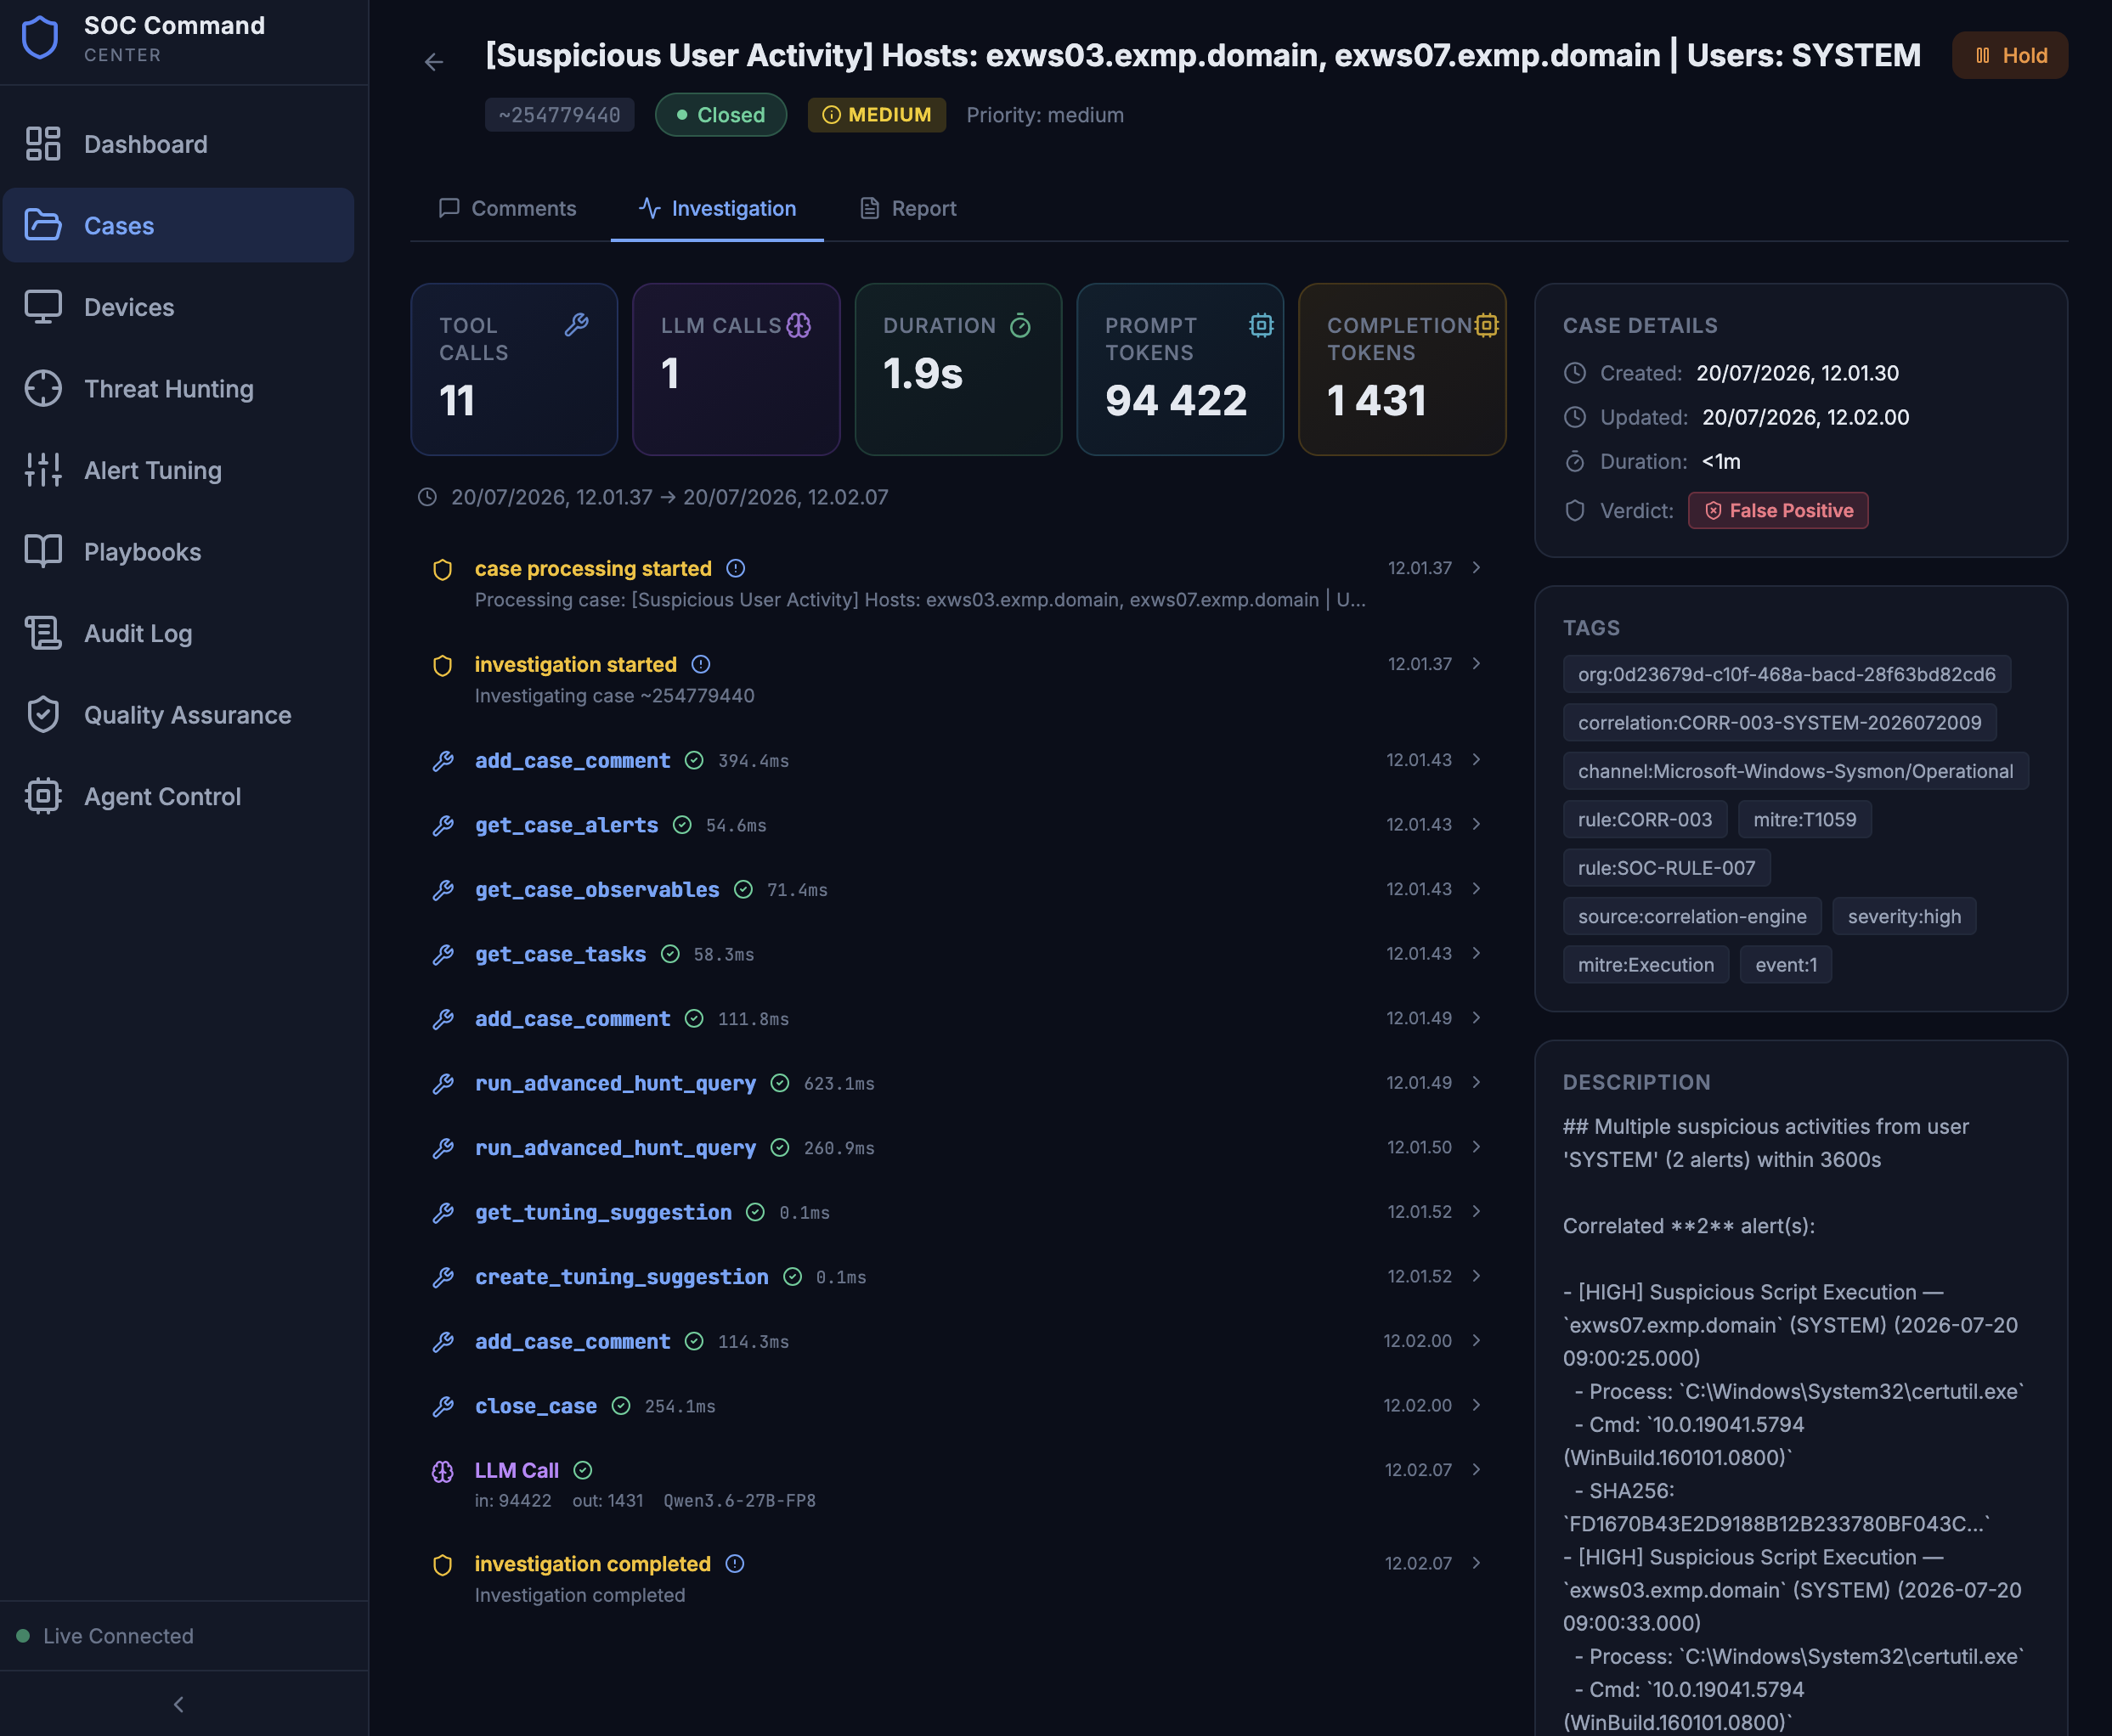
I basically just wanted to see what the agent was actually doing under the hood. I’ve built in a dedicated investigation timeline that pulls from the audit logs. I can see every single tool call and LLM prompt the agent used for a specific case. It turns the black box of an LLM into something I can audit. If the agent goes off the rails, I don’t have to guess why. I just look at the timeline and see exactly where the logic broke.
I also spent a lot of time on the memory aspect. The GUI has endpoints for the RAG memory and investigation patterns, so I can see what the agent is remembering from previous cases. It’s basically a window into the agent’s brain. Between the QA agent that reviews cases for discrepancies and the threat hunting trigger, this is less of a dashboard and more of a control plane for the whole autonomous stack.
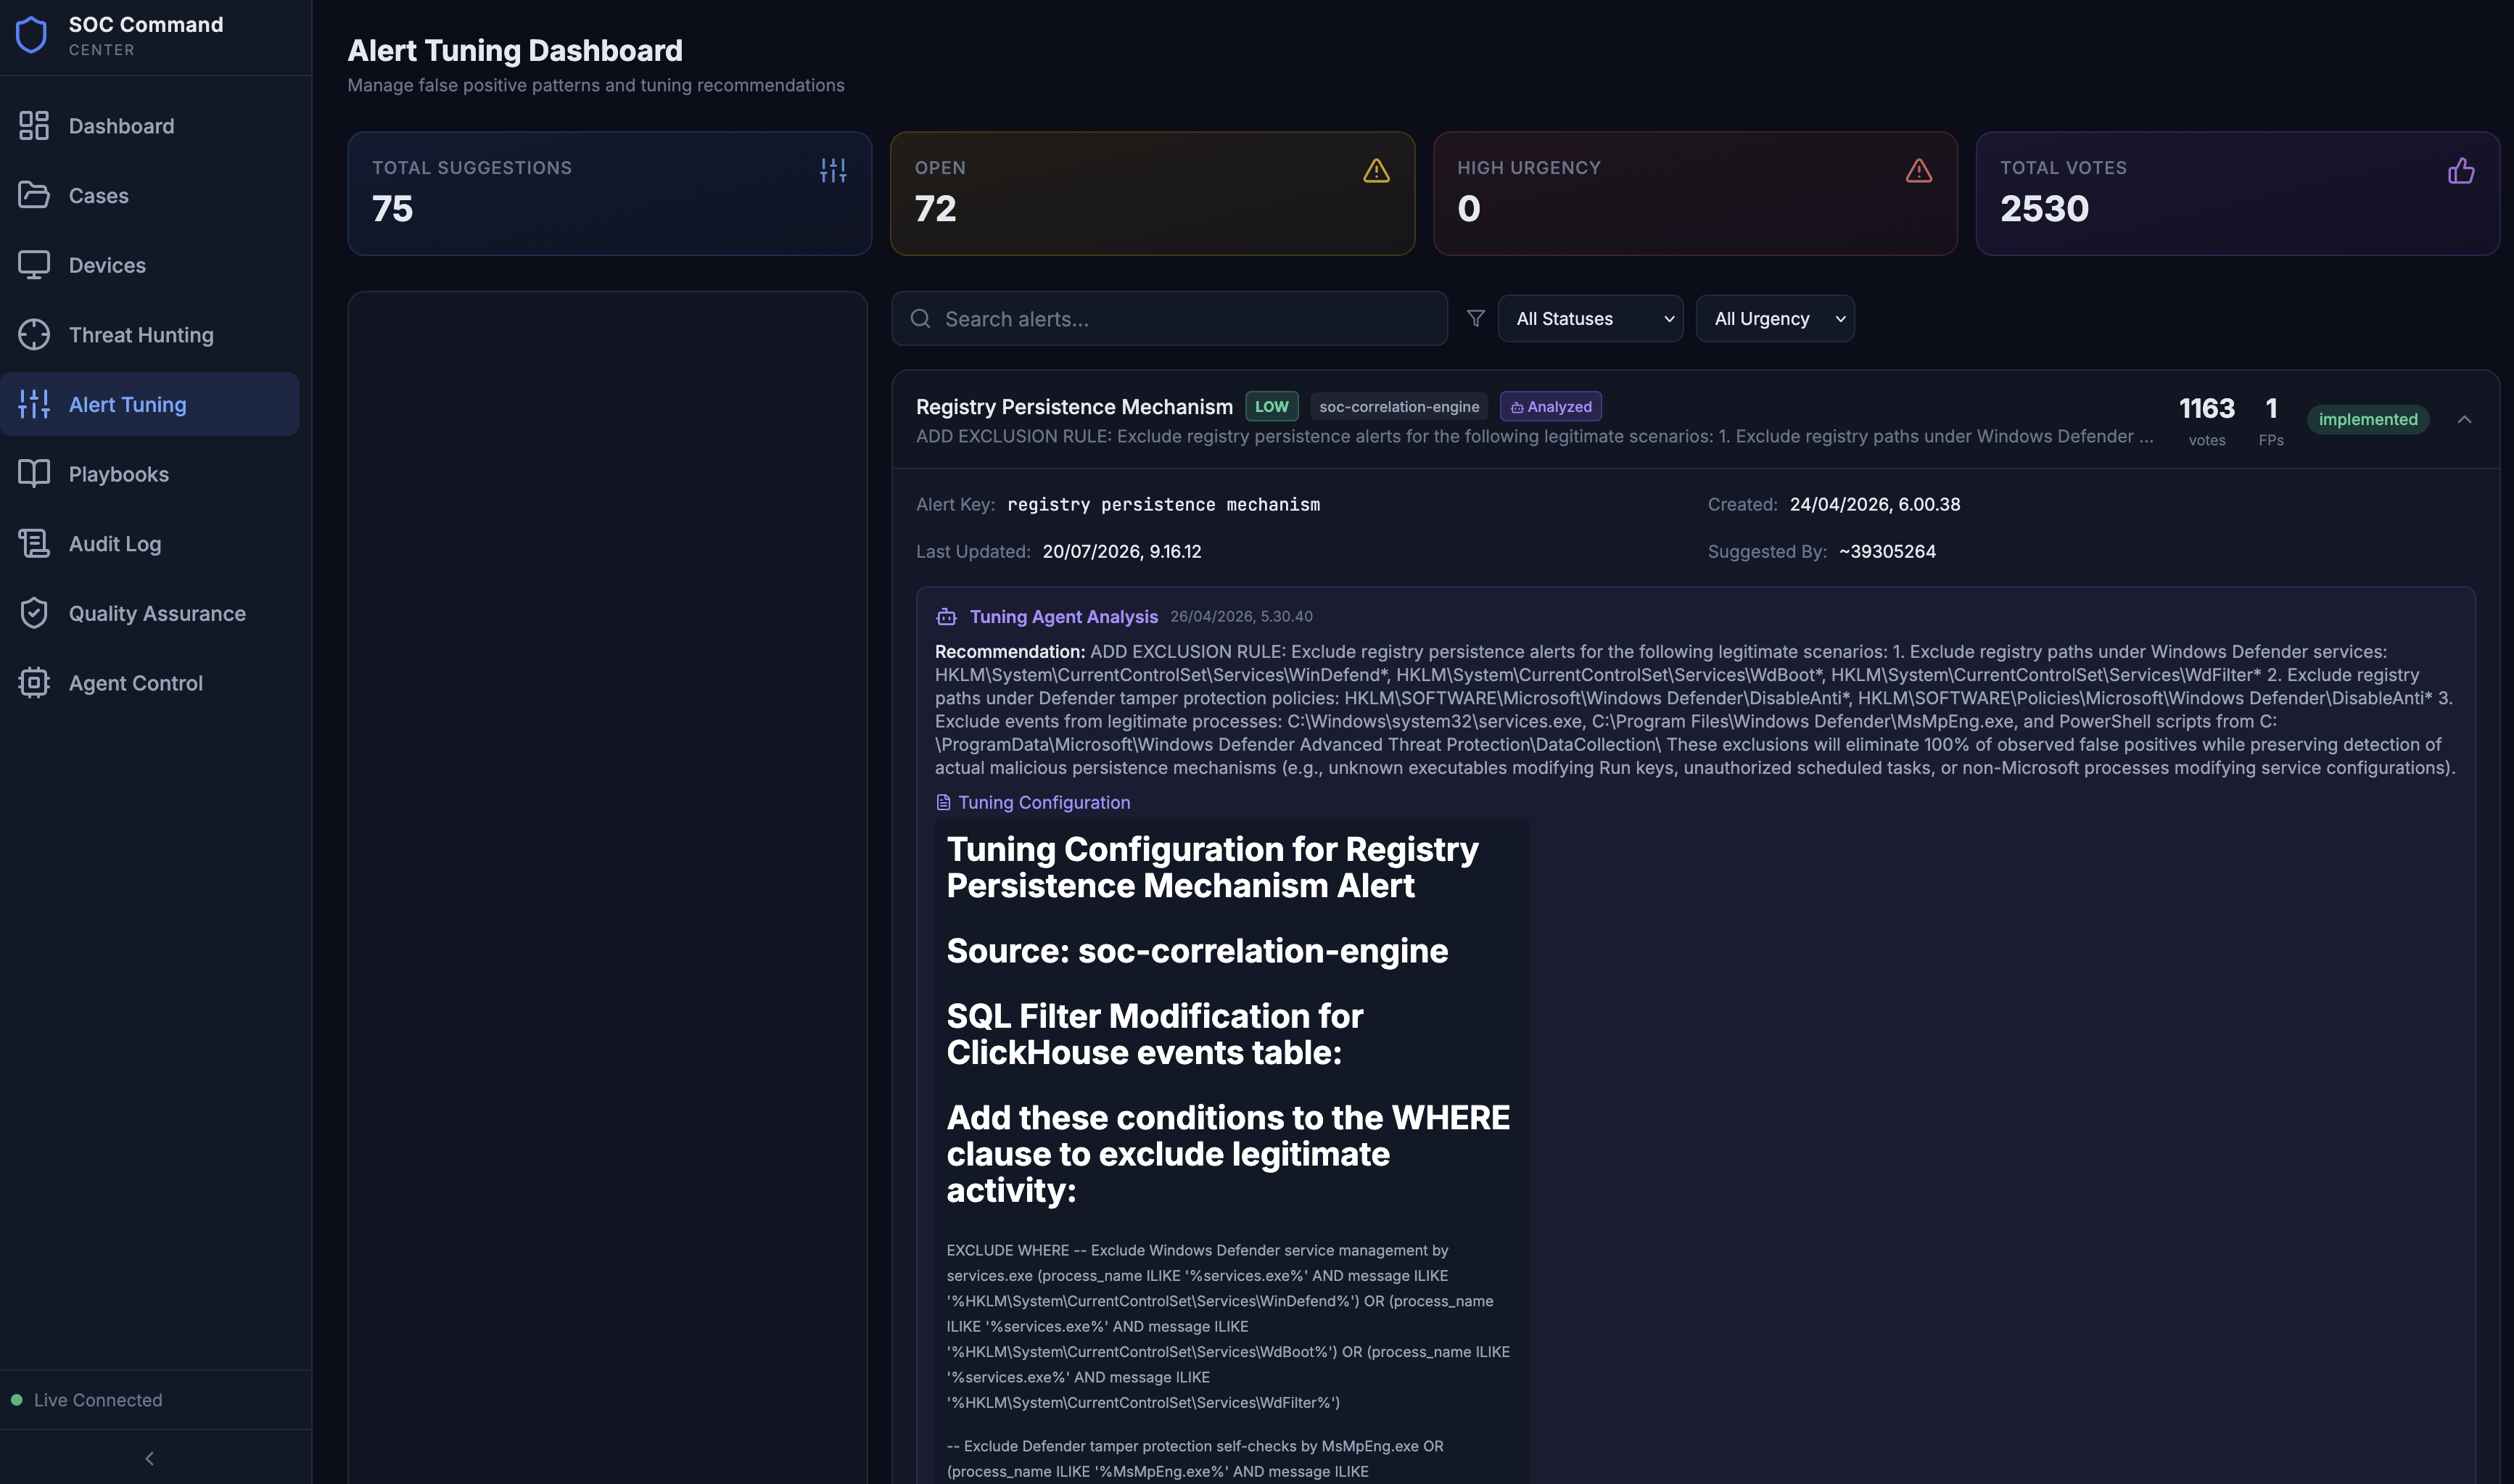
The Agent Layer
I didn’t want just one monolithic agent trying to do everything. I split the logic into specialized agents. You’ve got the main SOC agent handling the day-to-day triage, but I added a QA agent and a Threat Hunting agent to handle the proactive and quality-control side of the house. I already mentioned the reporting and tuning part, but I wouldn’t really go as far as call them agents. Maybe functions? I don’t know.
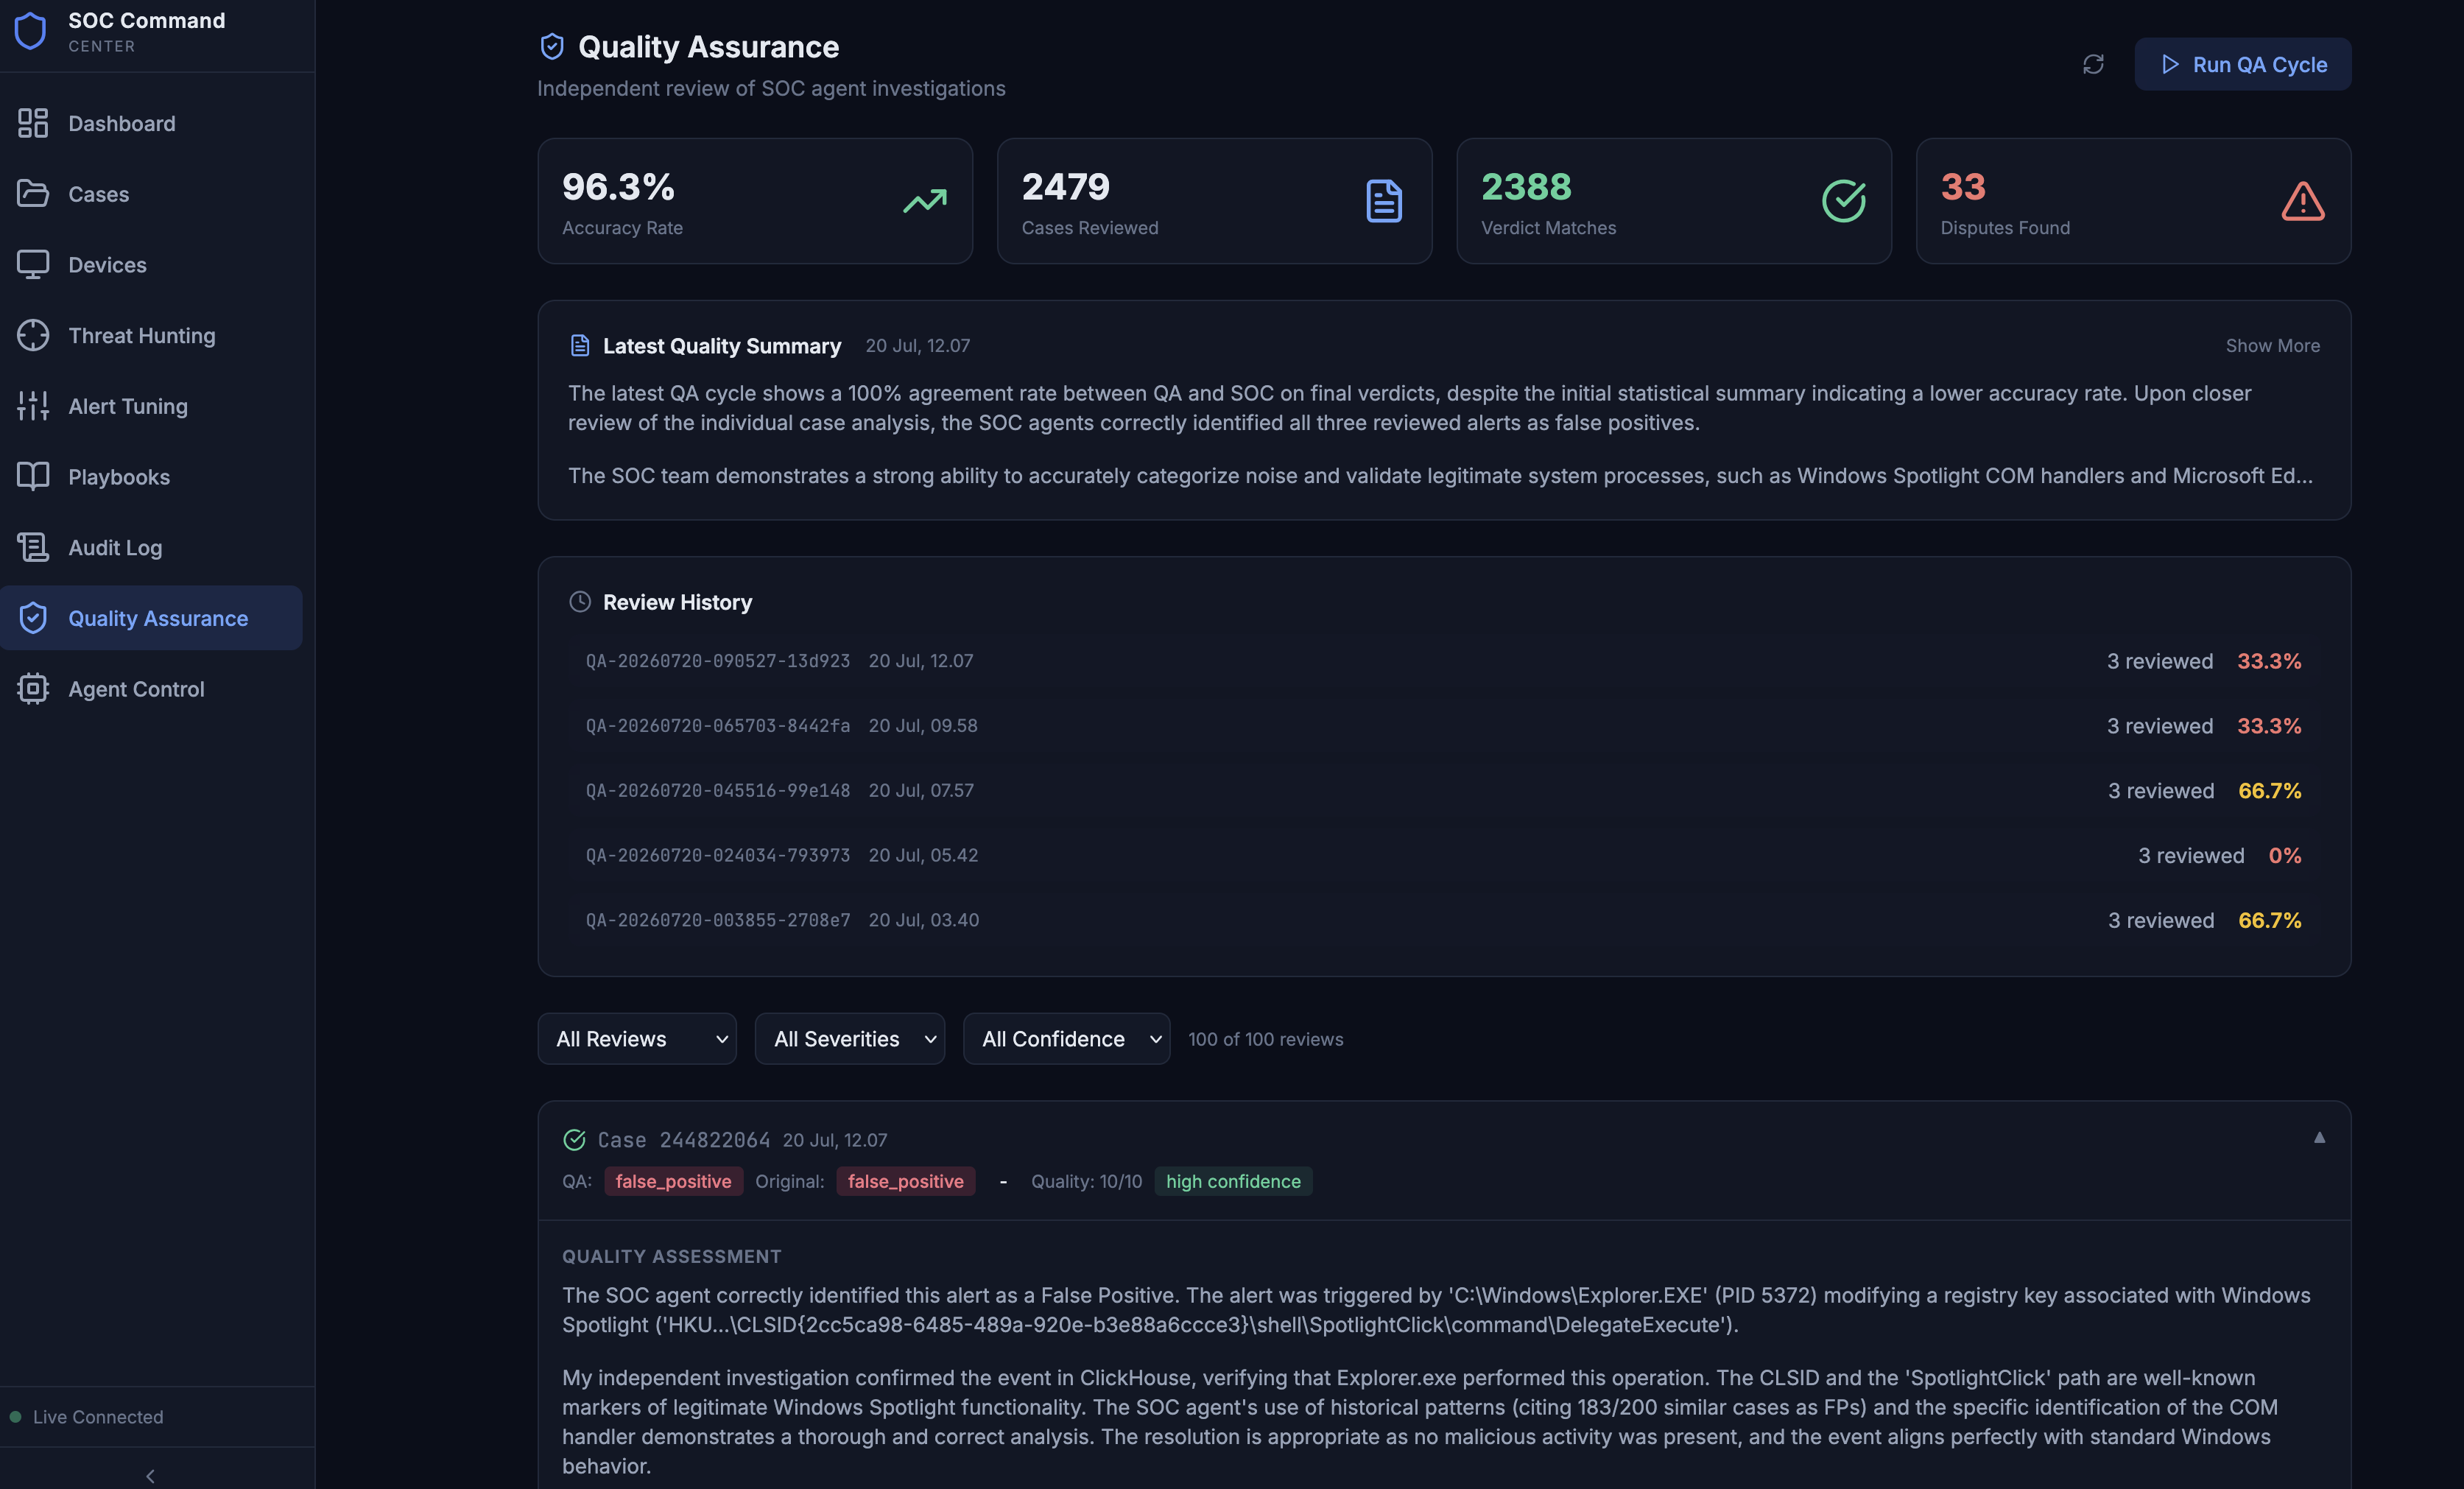
The QA agent is basically my digital auditor. It randomly samples closed cases, re-investigates them from scratch without looking at the original analyst’s conclusion, and then compares the two. If the SOC agent called it a false positive but the QA agent finds a clear beacon to a known C2, it flags it as a dispute. I’ve got it scoring investigations from 1 to 10 on thoroughness and documentation. It’s a good way to actually know if your autonomous pipeline is hallucinating its way to a benign verdict. It works pretty well and while the screenshot only shows aligned opinions, it’s not always going to align with the analysis done. This opens up the possibility to use frontier model to do the QA part as smaller model is perfectly capable of the day to day analysis (I am running everything offline on my own hardware).
Then there’s the Threat Hunting agent. Most “AI hunting” is just a fancy wrapper for a keyword search, but I wanted this to be driven by actual intelligence. The agent pulls enriched cyber news which I store in OpenSearch (of course enriched with LLM analysis), scrapes the web for CVE details or TTPs, and then tries to write its own ClickHouse SQL to find those patterns in the data.
The best part is the iteration loop. If the agent writes a query that fails because of a column mismatch or a syntax error, it doesn’t just crash. It reads the error, fixes the SQL, and retries. Once it finds something meaningful, it assesses whether the query is production-ready to be turned into a permanent detection rule. It avoids the trap of producing massive reports that no one reads, instead spitting out short and sweet YAML summaries for easy consumption. With some efforts this process could be automated so that the agent pushes it for further analysis for Detection Engineering agent which then can also push to production.
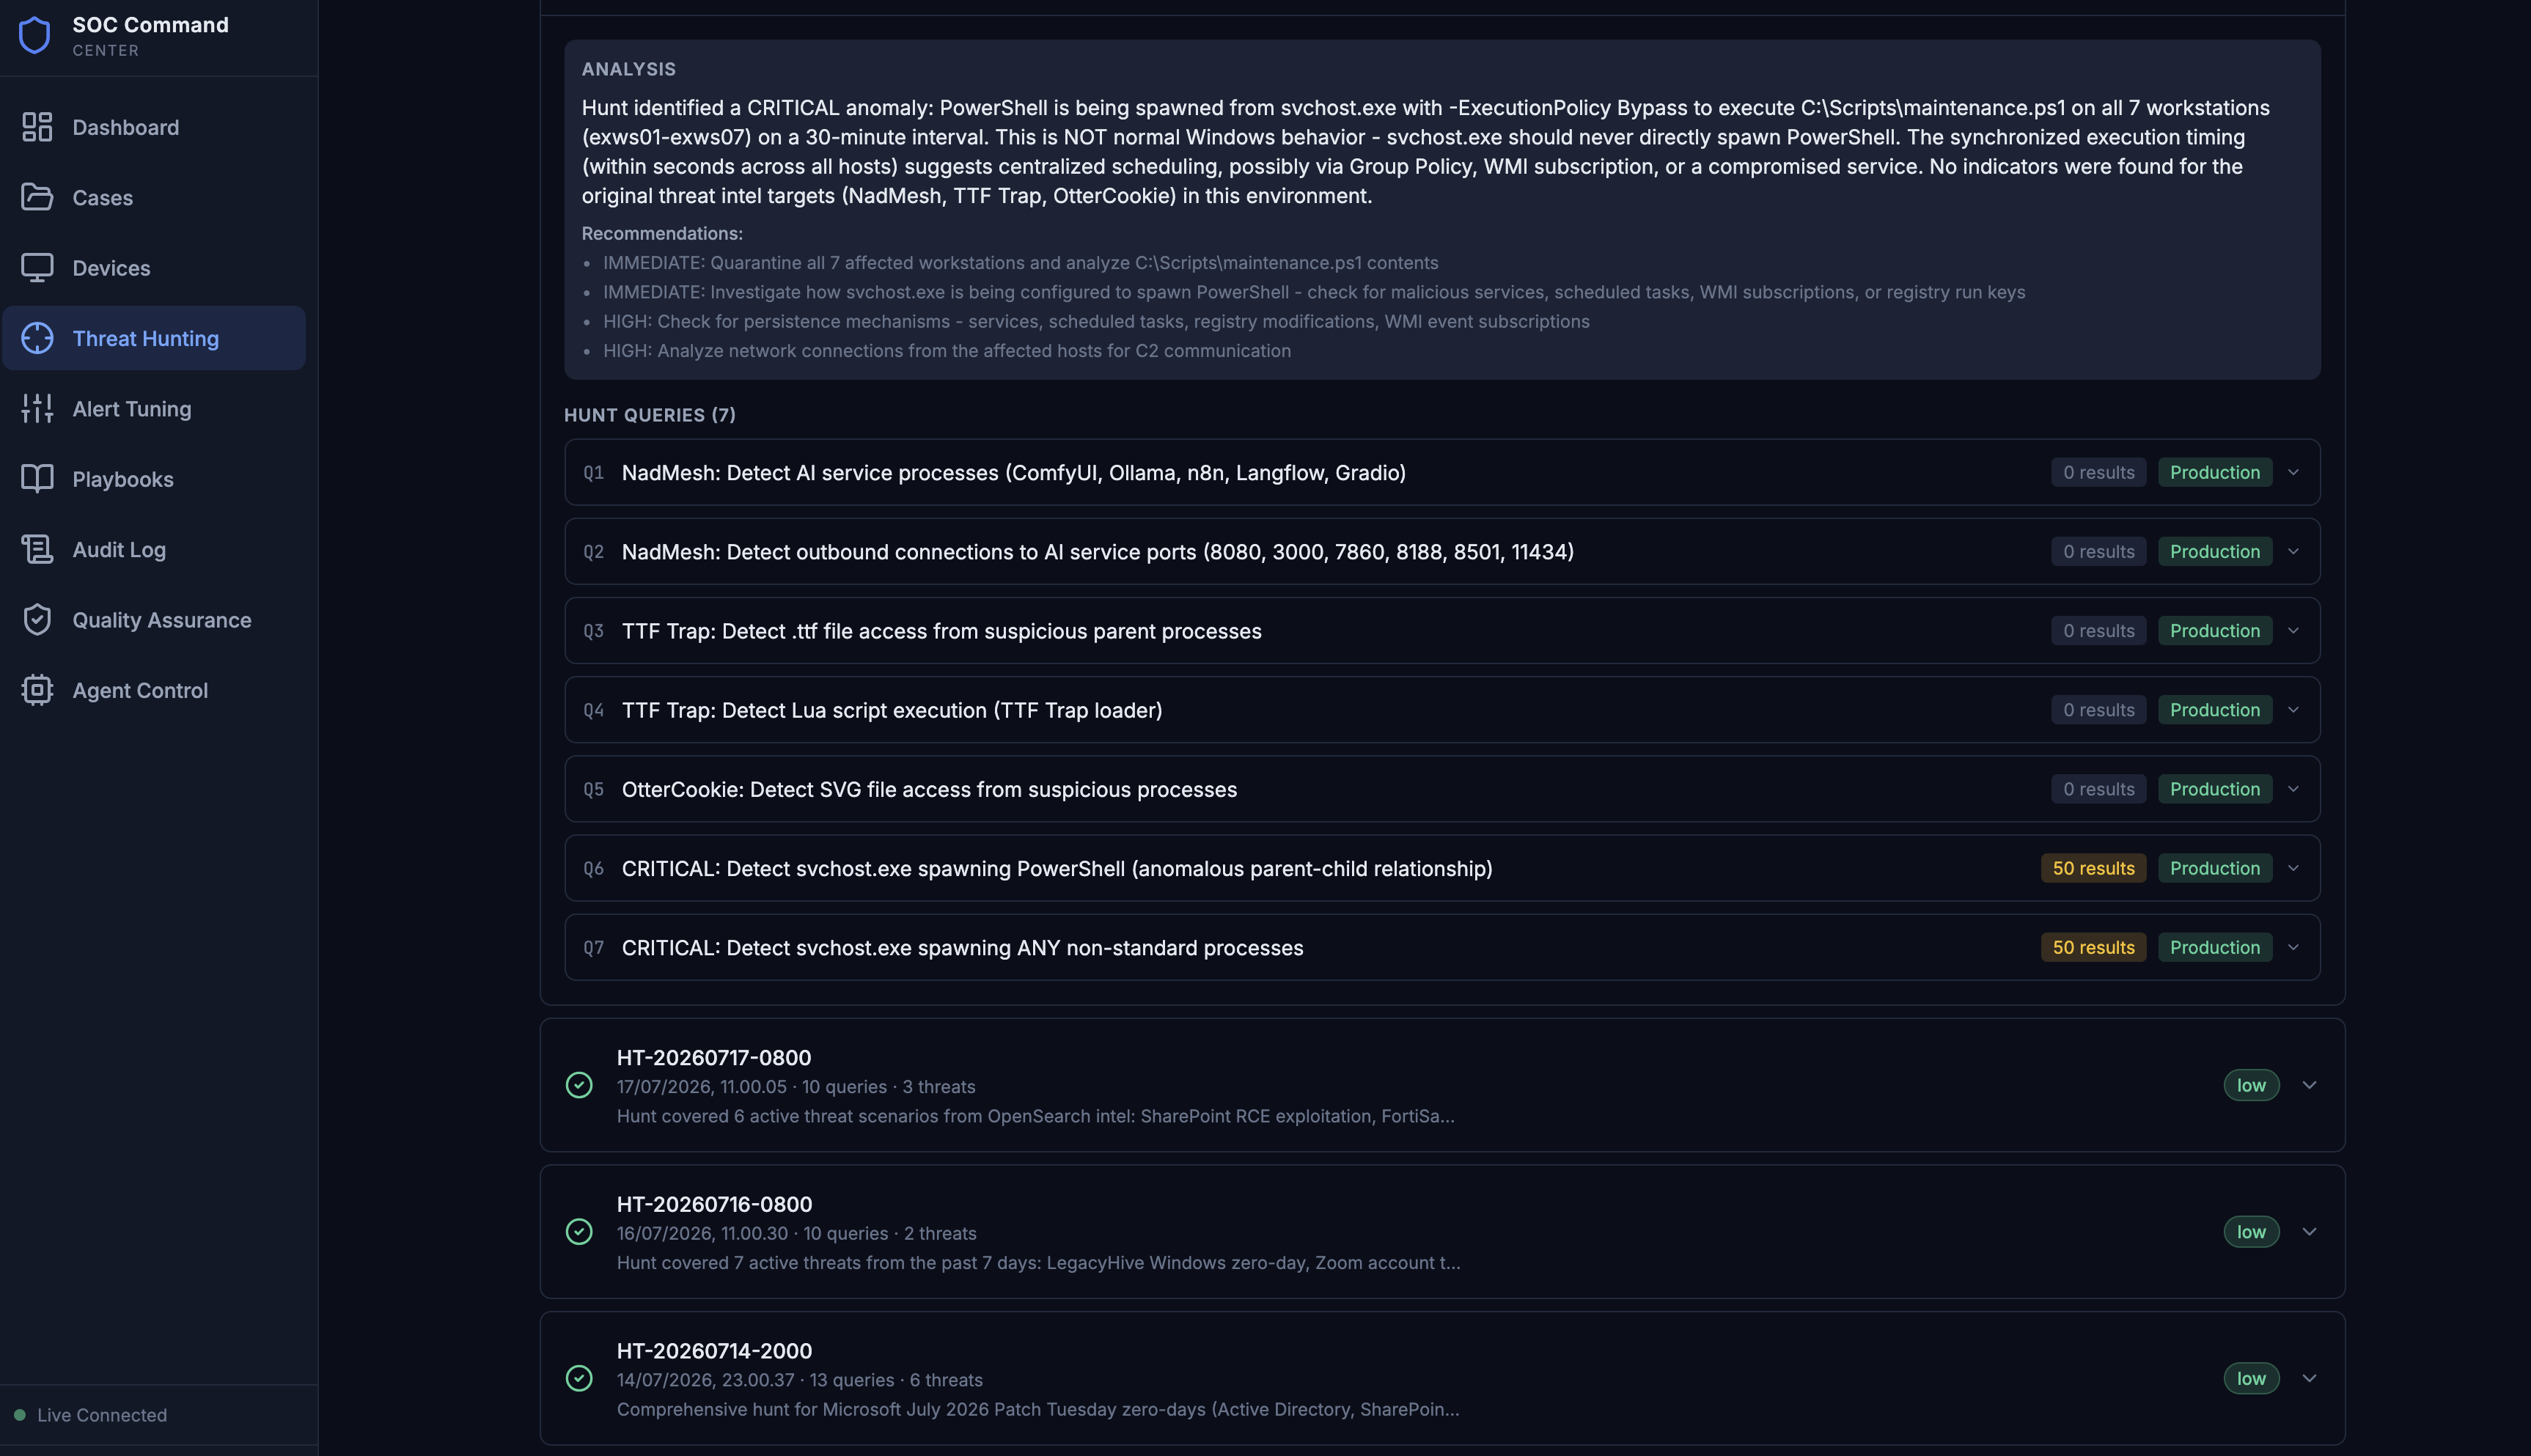
The whole thing is orchestrated through the GUI, where I can trigger a hunt or a QA cycle and watch the logs roll in. I’ve integrated a memory system too, using RAG for investigation patterns, so the agents don’t keep making the same mistakes. It’s a feedback loop: the hunter finds a new threat, the SOC agent handles the alerts, and the QA agent makes sure neither of them messed up. Honestly, it’s the closest I’ve gotten to a SOC that actually manages itself.
Final Thoughts
Look, this is still a PoC. But the shift is real; moving from manually triaging a thousand alerts to auditing the agent’s work, improving and implementing new features. It’s a different kind of stress, but it’s a much more interesting one, at least to me.
The goal here wasn’t to build some magic box that replaces the analyst. It’s about killing the boring stuff. When you stop fighting with your SIEM and start focusing on the logic of the hunt, everything changes. Next on the list could be a dedicated Detection Engineering agent to close the loop entirely, taking those production-ready queries from the hunter and pushing them straight into the pipeline. I’ve built some of similar agents in real life too; which is pretty cool and works nicely though there are of course real implications of things done. Love building this stuff though.
 Machine Learning for Threat Hunting